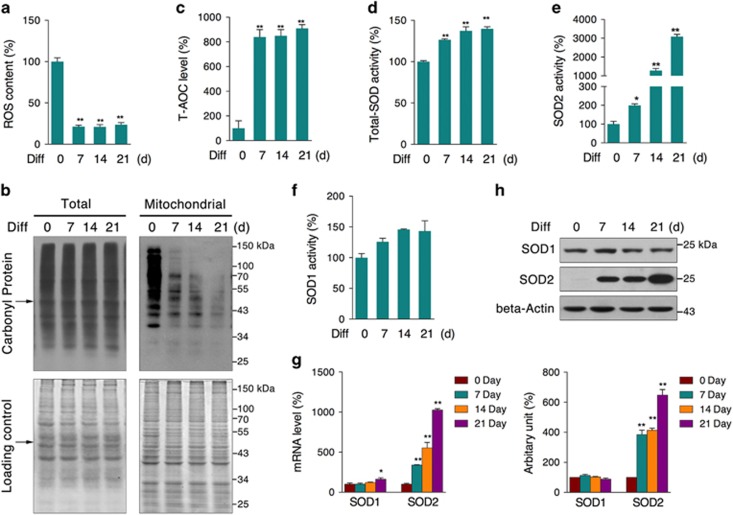
Figure 3.
Elevated antioxidative capacity during osteogenic differentiation. MC3T3-E1 cells were induced to differentiate for 7, 14, and 21 days, and cellular antioxidative capacity was evaluated by testing (a) cellular ROS content, (b) total and mitochondrial carbonyl protein levels, (c) T-AOC, (d) total-SOD activity, (e) SOD2 activity, (f) SOD1 activity, (g) mRNA levels of SOD1 and SOD2, and (h) protein levels of SOD1 and SOD2. Data are presented as the mean±S.E.M. from at least three independent experiments. *P<0.05, **P<0.01 versus relative control

