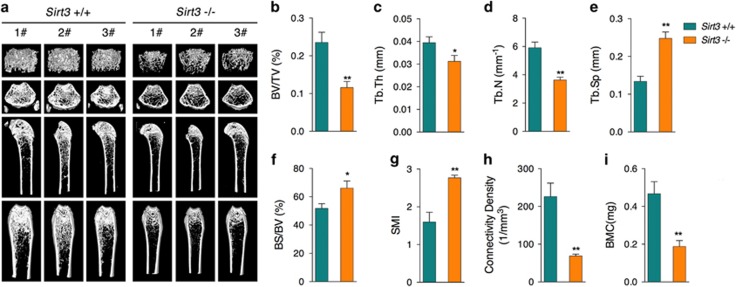
Figure 6.
Decreased bone mass in Sirt3−/− mice. (a) Micro-CT images of the femurs of wild-type (Sirt3+/+) and SIRT3-knockout (Sirt3−/−) mice. In the analysis of the trabecular bone and architecture, the following parameters were calculated: (b) bone volume per tissue volume (BV/TV); (c) trabecular thickness (Tb.Th); (d) trabecular number (Tb.N); (e) trabecular spacing (Tb.Sp); (f) bone surface to bone volume (BS/BV); (g) structure model index (SMI); (h) connectivity density; and (i) bone mineral content (BMC). Data are presented as the means±S.E.M.; n=6 per group. *P<0.05, **P<0.01 versus relative control

