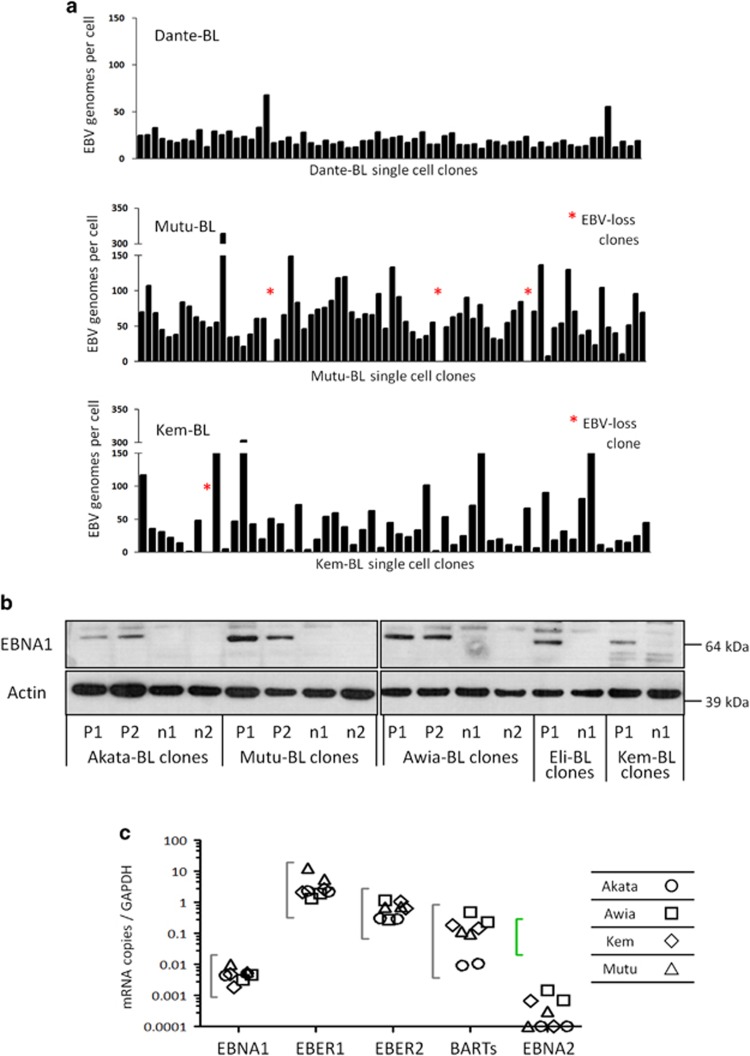
Figure 2.
Genome loads and viral gene expression in BL single-cell clones. (a) Cells from each clonal cell line grown from a single cell by limiting dilution were harvested, lysed and analysed by q-PCR to enumerate the average EBV genome copy number per cell. Quantitation was calculated relative to Namalwa-BL cells, which contain two integrated copies of EBV per cell and these data were normalised to the housekeeping gene, β2M, of which diploid cells carry two copies. Clones of Dante-BL showed little variation in EBV copy number and yielded no EBV-loss clones, whereas Mutu-BL and Kem-BL cells had more variable genome loads and yielded EBV-loss clones (denoted by an asterisk). (b) Expression of EBV latent protein, EBNA1, in isogenic EBV-positive (P1-P2) and EBV-loss (n1-n2) BL clones. Probing for β-actin was used as a loading control. (c) Transcription of Latency I-associated genes in EBV-positive clones of Akata-BL (◯), Awia-BL (□), Kem-BL ( ) and Mutu-BL (Δ) expressed relative to the endogenous control, GAPDH, and shown relative to the range seen in a panel of eight Latency I BL cell lines (grey bracket), including those from which the EBV-loss clones were isolated, as described elsewhere.53 EBNA2 expression is shown compared with the range seen in a panel of five LCLs (green bracket). EBNA1 refers to Q-U-K transcripts driven from the Qp promoter that are indicative of Latency I. BARTs refers to BamHI A transcripts that are spliced between exons 1 and 3 (the excised RNA gives rise to miR-BARTs)

