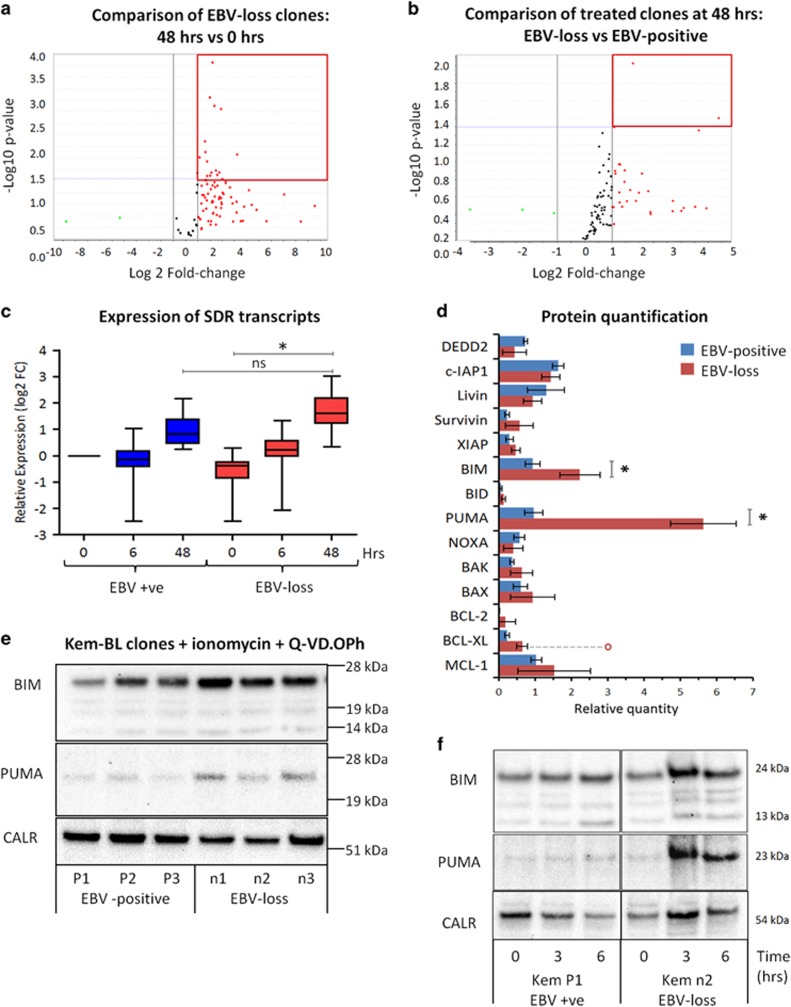
Figure 6.
Apoptosis-related transcript and protein expression in ionomycin+Q-VD.OPh-treated Kem-BL clones. (a) Volcano plot of changes in apoptosis-related transcripts in EBV-loss BL clones treated with ionomycin and Q-VD.OPh for 48 h versus 0 h. The red box indicates significantly differentially regulated genes, as determined using cutoffs of FC >2 and P-value <0.05. (b) Volcano plot of transcriptional changes in apoptosis-related genes in EBV-loss clones compared with their EBV-positive counterparts, treated with ionomycin and Q-VD.OPh for 48 h. The red box indicates the significantly differentially regulated genes, as determined using cutoffs of FC >2 and P-value <0.05. (c) Box plot of expression data for the 13 genes that are differentially regulated between EBV-loss clones treated for 48 versus 0 h, but not between EBV-positive and EBV-loss BL clones at 48 h. This subset appears to be an EBV-loss-specific gene expression signature. However, this comparison illustrates that this subset of genes is also upregulated in EBV-positive BL clones, but to a lesser extent than in the clones that have lost EBV. (d) Summary of apoptosis-related protein expression in EBV-positive (blue) versus EBV-loss (red) clones of Kem-BL treated with ionomycin and Q-VD.OPh for 48 h. Quantitation is relative to untreated Jurkat cells. Three proteins, which we found to be undetectable in Kem-BL, are omitted (CFLAR, BAD and CASP8AP2). Data are presented as mean and S.D. of three separate experiments. Red circle in BCL-XL expression data represents one outlier result from a single EBV-loss clone. (e) BIM and PUMA protein expression in EBV-positive (P1–P3) versus EBV-loss (n1–n3) Kem-BL clones treated with ionomycin and Q-VD.OPh for 48 h. Calregulin (CALR) was included as a loading control. Images are representative from three independent experiments. (f) Western blots showing BIM and PUMA expression in EBV-positive Kem-P1 cells compared with EBV-loss Kem-n2 cells at 0, 3 or 6 h after treatment with ionomycin plus Q-VD.OPh, compared with the loading control, calregulin (CALR). Expression data for all samples at all time points post exposure to ionomycin in hours (h) are expressed relative to EBV-positive BL clones at time 0. Statistical significance was determined using a two-tailed Student’s T-test, **P<0.01, *P<0.05 and ns is not significant

