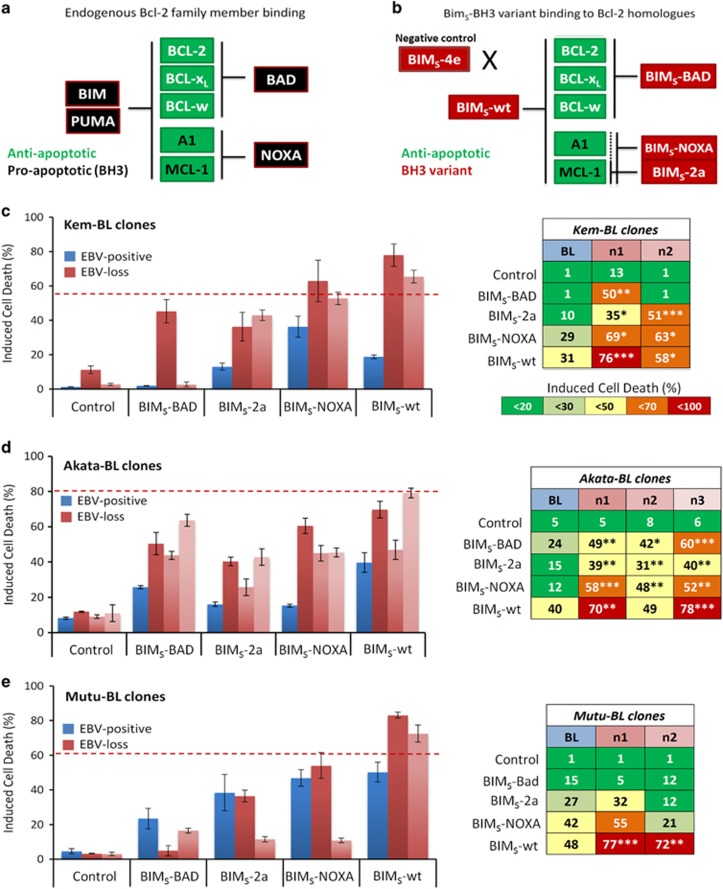
Figure 7.
Apoptotic phenotype of EBV-positive and EBV-loss clones of BL clones expressing dox-inducible BIMS-BH3 variants. (a) Binding specificity of endogenous prosurvival BCL-2 family members (green) to proapoptotic BH3-only proteins (black). (b) Binding specificity of BIMS-BH3 variants (red) to the different prosurvival BCL-2 family members (green), dotted line indicates weak binding of BIMS-2a to A1/BFL1. (c–e) Apoptosis in EBV-positive (blue) versus EBV-loss clones (red) of Kem-BL (c), Akata-BL (d) and Mutu-BL (e) expressing BIMS variants; BIMS-4e (negative control), BIMS-BAD, BIMS-2a, BIMS-NOXA and BIMS-wt. The left panel shows representative data (mean and S.D.) for a single experiment and the right-hand panel shows mean values from three independent experiments. Induced cell death was calculated relative to cell death in untreated control cells. All samples were treated with doxycycline to activate BIMS variant expression and induce cell death. Viable cells were defined as Annexin-V/propidium iodide (PI) double negative. Statistical significance was determined using a two-tailed Student’s T-test to compare cell survival in each EBV-loss clone to the EBV-positive control in response to each BIMS-BH3 variant. Where a variant induced significantly more death in an EBV-loss clone compared with the EBV-positive control, this is noted in the right-hand panel, ***P<0.001, **P<0.01 and *P<0.05. The average amount of death induced by ionomycin treatment in EBV-loss clones from each tumour background is denoted by a dashed red line for comparison

