Figure 2.
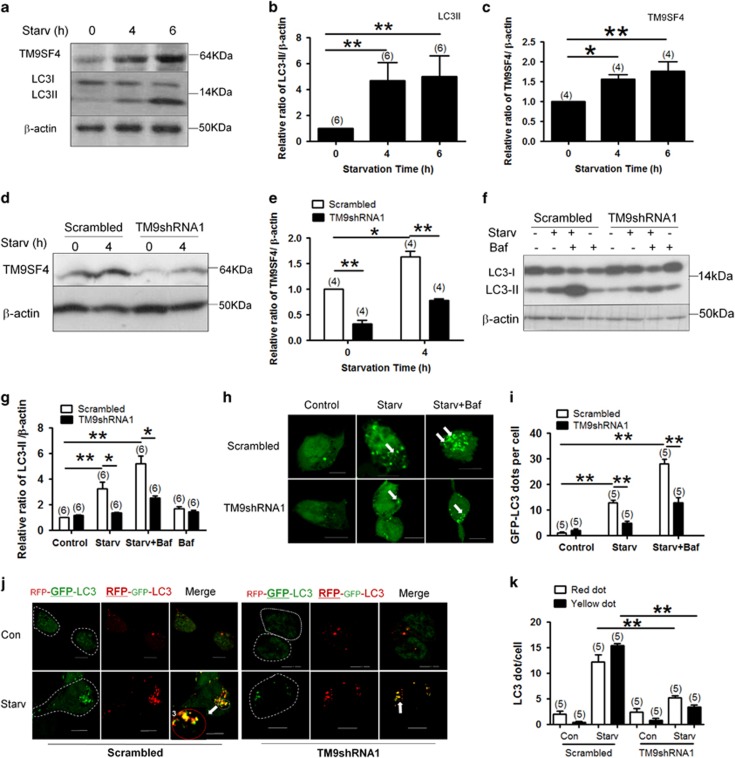
Knockdown of TM9SF4 using lenti-TM9SF4-shRNA1 inhibited the starvation-induced autophagic flux in HEK293 cells. (a–c) Amino acid starvation in EBSS for 4 and 6 h increased the expression of TM9SF4 and LC3-II in HEK293 cells. Shown are representative immunoblot images (a) and data summary (b and c). (d and e) Representative immunoblot images (d) and data summary (e) demonstrating the effectiveness of TM9SF4-shRNA1 in knocking-down TM9SF4 expression in HEK293 cells under basal and starvation conditions. Lenti-TM9SF4-shRNA1 or its scrambled control was stably transduced into HEK293. (f and g) Effect of TM9SF4-shRNA1 in reducing the LC3-II level in the presence or absence of bafilomycin A1 (Baf, 10 nM). Shown are representative immunoblot images (f) and data summary (g). (h and i) Effect of TM9SF4-shRNA1 in reducing GFP-LC3 puncta formation in the presence or absence of bafilomycin A1 (Baf, 10 nM). Shown are LC3 fluorescent signals from representative single cells (h) and data summary (i). (j and k) HEK293 cells were transfected with a tandem reporter RFP-GFP-LC3. Shown are the effect of TM9SF4-shRNA1 on the formation of autophagosome (yellow dots in merged images) and autolysosome (red dots in merged images) with representative images (j) and data summary (k). In (f–k), amino acid starvation was carried out in EBSS for 2 h. In (h–k), quantification of autophagosome and autolysosome were performed using ImageJ. Scale bar=10 μm. Summary data are presented as mean±S.E.M. (n as labeled in the figures; >100 cells per experiment in (i and k). *P<0.05; **P<0.01. The values in (b,c,e and g) were normalized to β-actin level

