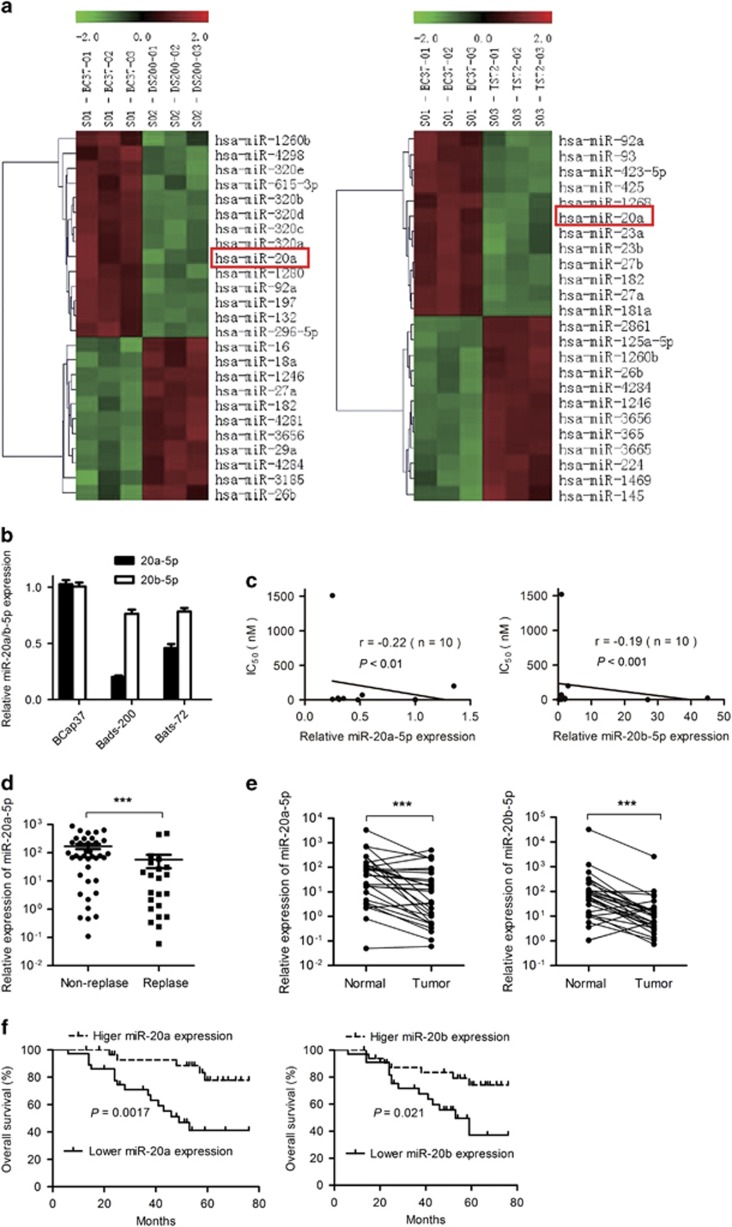
Figure 1.
Identification of chemoresistance-related miRNAs by miRNA microarray and high-content screening system. (a) Comparison of miRNA expression in parental cell BCap37 and chemoresistant cell Bads-200 (left) and Bats-72 (right) by using the miRNA microarray. BC37, BCap37; DS200, Bads-200; TS72, Bats-72. Each cell was tested in triplicate. (b) MiR-20a/b expression in BCap37, Bads-200 and Bats-72 cell lines was detected using q-PCR. (c) The expression levels of miR-20a/b in cell lines BCap37, Bads-200, Bats-72, MDA-MB-453, MDA-MB-468, MDA-MB-231, MCF-7, Hs-578T, BT-474 and Sk-Br-3 were detected by q-PCR. The relationship between the expression level of miR-20a/b in each cell and their corresponding half-maximal inhibitory concentration (IC50) to PTX are shown. (d) MiR-20a expression levels were reduced in samples of patients who relapse after chemotherapy compared with patients who did not relapse (n=63). (e) MiR-20a/b expression levels were reduced in human breast cancer samples (n=30) compared with paired noncancerous tissues. (f) Retrospective analysis of Kaplan–Meier plots for miR-20a/b expression in association with overall survival. Patients were split into high and low expression groups by the mean expression of the miR-20a/b (n=66; log-rank test). ***P<0.001

