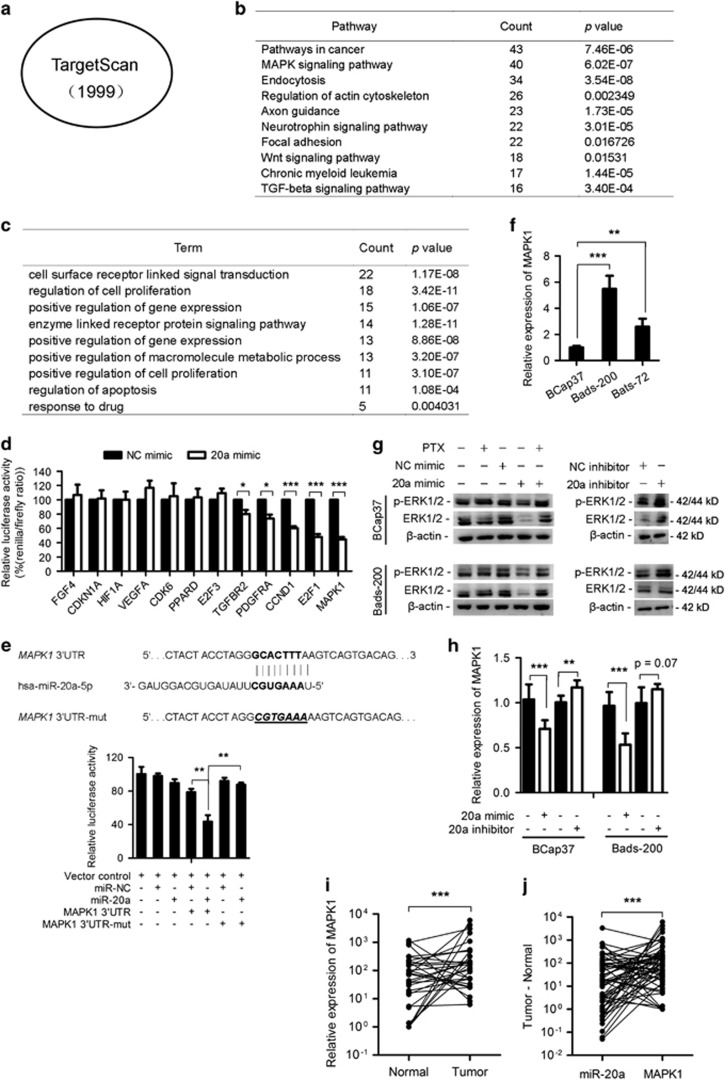
Figure 4.
MAPK1 is one of the direct target of miR-20a. (a) A total of 1999 miR-20a target genes were predicted by TargetScan. (b) Enrichment analysis of predicted miR-20a targets as indicated in (a) in KEGG cell signaling pathway database. (c) Gene ontology (GO) analysis of the genes involved in the pathways in cancer and MAPK signaling pathway in (b). (d) Dual-luciferase assays showing that repression of candidate genes by miR-20a was measured as ratios of Renilla and Firefly luciferase activity in BCap37 cells. Mean±S.E.M. are shown from at least three independent experiments. (e) Predicted sequences between wild-type (WT) or mutant (mut) MAPK1 3′ UTR and miR-20a. The underscore portions of the sequences represent the mutant miR-20a binding sites in MAPK1 3′ UTR (up). Luciferase reporter assay showed the decreased luciferase activity in miR-20a-overexpressed cells for 3′ UTR constructs. The luciferase activity was normalized to Renilla luciferase. (f) q-PCR analysis of the expression of MAPK1 mRNA in BCap37, Bads-200 and Bats-72. (g and h) Western blot (g) and q-PCR (h) analysis of MAPK1 protein and mRNA levels after the transfection of miR-20a mimic, miR-20a inhibitor (anti-miR-20a) or their negative controls (mimic NC and inhibitor NC) in BCap37 and Bads-200 cells. (i) q-PCR analysis of MAPK1 expression levels from 30 breast cancer samples and their adjacent normal tissues. (j) Plotting the paired difference of tumor and normal samples expression for each marker (miR-20a versus MAPK1). The exact McNemar’s test indicates a significant association between the upregulation of expression in MAPK1 and the downregulation of miR-20a expression (n=60). *P<0.05, **P<0.01, ***P<0.001

