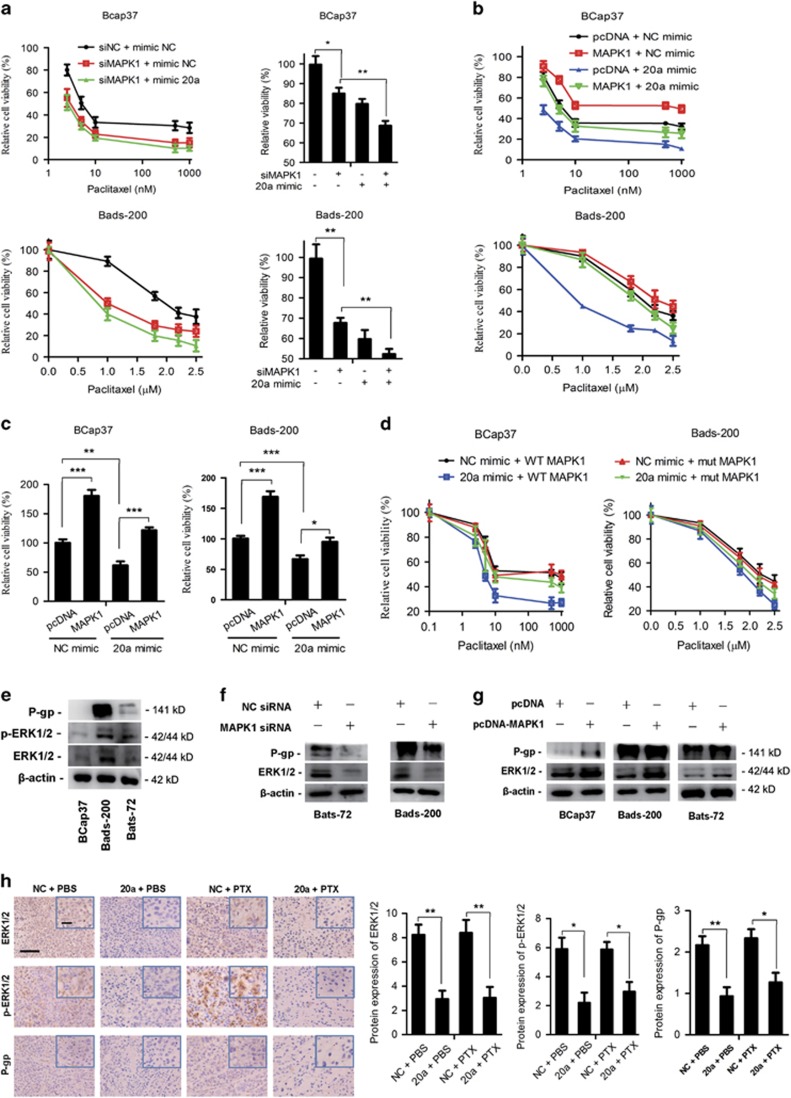
Figure 5.
MiR-20a inhibits the proliferation and resistance of breast cancer cells by inhibiting MAPK1 and thereby inhibiting P-gp. (a) Cell proliferation assays of BCap37 (up) and Bads-200 (down) cells transfected with MAPK1 siRNA (siMAPK1) or control siRNA (siNC) and then treated with miR-20a mimic and miRNA mimic negative control (NC mimic). (b) Ectopic expression of MAPK1 restored resistance to PTX in miR-20a-overexpressing BCap37 (up) and Bads-200 (down) cells. (c) Cell proliferation assays of BCap37 (left) and Bads-200 (right) cells transfected with MAPK1-expressing plasmid or control plasmid and then treated with miR-20a mimic or miRNA mimic negative control (NC mimic). (d) Growth curves of BCap37 (left) and Bads-200 (right) cells transfected with MAPK1-expressing vectors containing wild-type or mutant 3′ UTR and then treated with miR-20a mimic and miRNA mimic negative control (NC mimic) at different PTX concentrations. (e) Expression of β-actin (internal control), ERK1/2, phosphorylated ERK1/2 and P-gp were detected by western blot in three cells. Data are shown as a representative of three independent experiments. (f and g) siRNA-mediated MAPK1 knockdown reduced P-gp levels (f) and expressing vector-mediated MAPK1 overexpression increased P-gp levels (g) as shown by western blot analysis. Data are shown as a representative of three independent experiments. (h) Representative images of tumor samples that were stained with MAPK1 and P-gp by IHC (left). The levels of MAPK1 and P-gp protein expression were measured (right). Bars: (main) 100 μm; (insets) 25 μm. *P<0.05, **P<0.01, ***P<0.001

