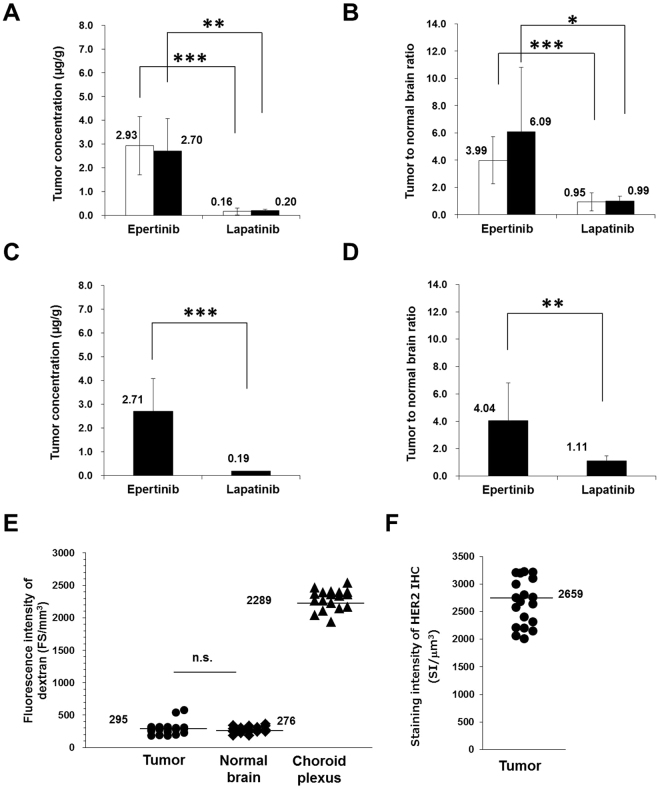
Figure 3.
Quantitative analysis of epertinib and lapatinib in IVMs of breast cancer by IMS. The tumor concentration and tumor-to-normal brain ratio at 4 h after oral administration of epertinib or lapatinib in IVMs of breast cancer with MDA-MB-361-luc-BR2 (BR2) (open bars) and MDA-MB-361-luc-BR3 (BR3) (filled bar) are shown in (A) and (B) (epertinib: BR2 (n = 19), BR3 (n = 8), lapatinib: BR2 (n = 25), BR3 (n = 11)). At 8 h after oral administration of epertinib or lapatinib in BR3 IVM, the tumor concentration and tumor-to-normal brain ratio are shown in (C) and (D) (epertinib: n = 15, lapatinib: n = 12). The results of statistical analysis (*P < 0.05, **P < 0.01, ***P < 0.001, epertinib versus lapatinib, Welch’s t-test) are presented in (A–D). Mice (n = 6) were sacrificed at 4 h after administration epertinib or lapatinib. Each point represents fluorescence intensity for each lesion of brain metastases (n = 20) of 6 mice and those for areas of normal brain (n = 18) and choroid plexus (n = 18), (3 points randomly selected for each mouse), (E). Each point shows staining intensity of HER2 immunohistochemistry (n = 19), (F) (n.s.: not significant).

