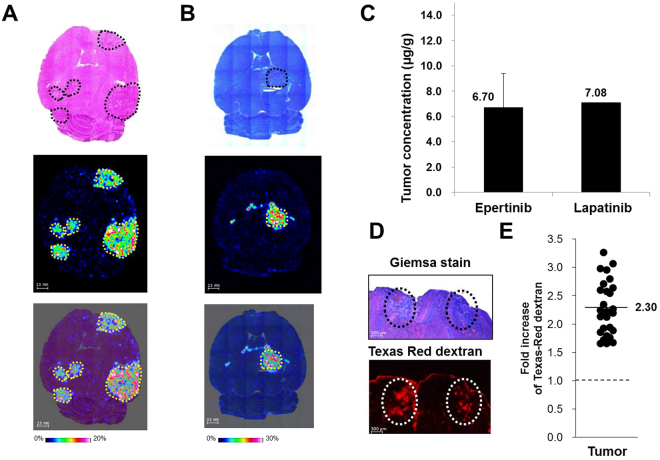
Figure 4.
Quantitative distribution analysis of epertinib and lapatinib in brain metastases of the lung cancer IVM. Representative images of horizontal brain sections of mice showing IVM with lung cancer (NCI-H1975-luc) at 4 h after oral administration of epertinib hydrochloride or lapatinib ditosylate monohydrate at a dose of 100 mg/kg (as epertinib (A) or lapatinib (B)). The ion images of epertinib (A) or lapatinib (B) are shown in middle row. In lower row, the ion images of epertinib (A) or lapatinib (B) are overlaid on the stained images ((A): H&E staining, (B): giemsa staining). The tumor regions are enclosed by dashed yellow lines (A and B). The tumo29r concentration at 4 h after oral administration of epertinib or lapatinib in IVM with lung cancer are shown in (C) (epertinib: (n = 13), lapatinib (n = 2)). Typical images of mouse brain sections showing giemsa staining (upper) and Texas-Red® dextran (3 kDa) fluorescence (lower) from IVM with NCI-H1975-luc brain metastases. Circles indicate the position of tumors (D). Each point represents fold increase of Texas-Red® dextran (3 kDa) fluorescence intensity for each region of brain metastases (n = 29) of 18 mice and those for areas of normal brain (n = 3) (E).

