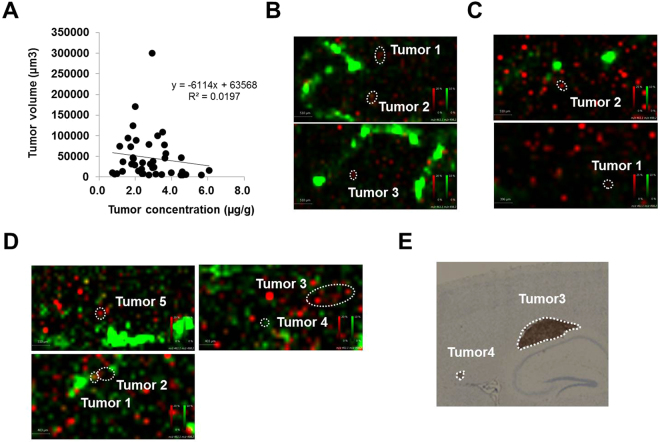
Figure 5.
Co-localization analysis of epertinib and heme B in brain of IVMs with breast cancer. Correlation analysis between the tumor epertinib concentration and the tumor volume (µm3), r2 = 0.02, number of metastases: n = 42, (A). Co-localization of epertinib (red) and heme B (green) in the brain sections of IVM with breast cancer (B and C), tumor concentration of epertinib: (B) tumor 3 > tumor 1 ≈ tumor 2, (C) tumor 2 > tumor 1. In the BR3 IVM sectioned brain, at 8 h after epertinib administration, only tumors 3 and 4 showed no correlation between tumor epertinib concentration (tumor 5 > tumor 1 > tumor 2, tumor 3 > tumor 4) and the ion intensity of heme B (D). The HER2 IHC image observed in tumor 3 and 4 in BR3 IVM with breast cancer is shown in (E).

