Figure 1.
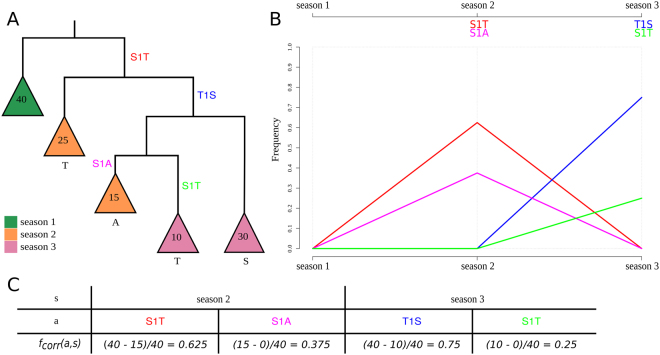
Phylogeny demonstrating the frequency correction, the corresponding SD plot and frequencies of amino acid changes. This is a detailed illustration of how the frequency correction handles individual amino acid changes that occur at the same position. The tree (A) consists of five main subtrees sampled from three seasons (colored in green, orange and purple). Each season exhibits forty isolates . contains four amino acid changes that occur on different internal branches: S1T (red), T1S (blue), S1A (pink) and S1T (light green). We consider S1T (red) and S1T (light green) as two separate amino acid changes with individual frequencies as they occur on different branches of the tree. Consequently, both are calculated separately and occur in the SD plot (B). Amino acid changes S1T (red) and S1A (pink) rise in frequency in the second season and disappear in the last season while T1S (blue) and S1T (light green) arise in the third season in the corresponding SD plot. Note that the frequencies for change S1T (red) and for T1S (blue) are corrected while the frequencies for S1A (pink) and S1T (light green) do not require a correction (C).

