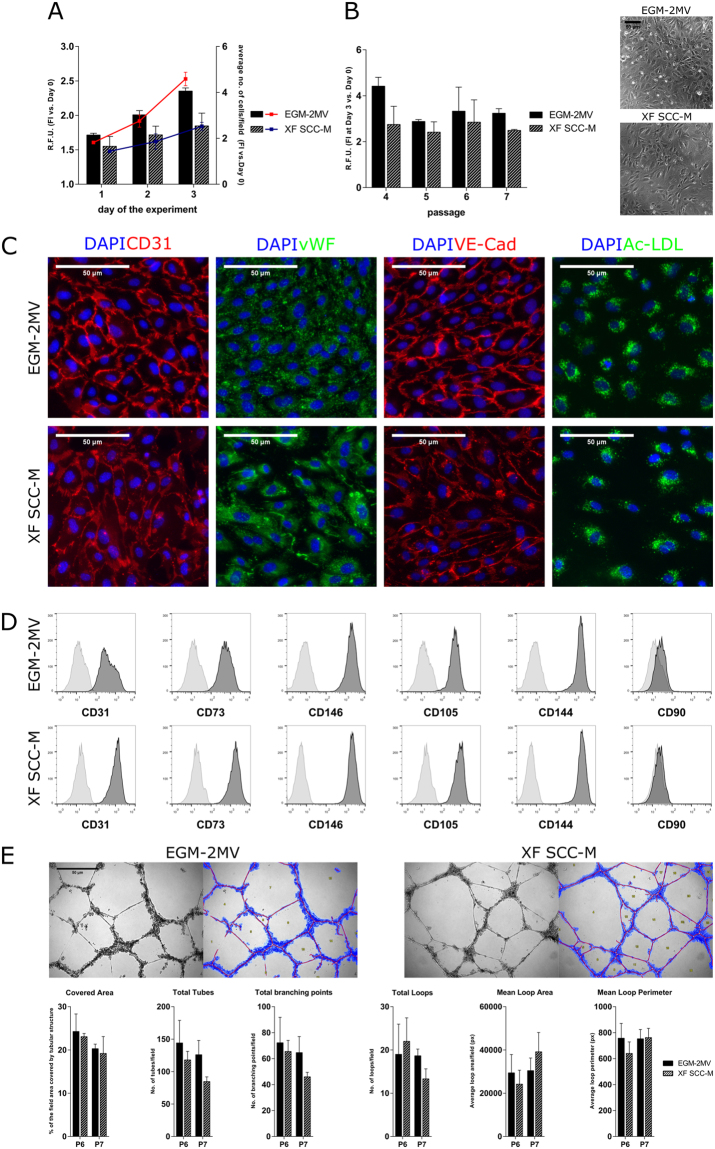
Figure 1.
Optimization of the XF SCC-M in OEC culture. (A) OEC proliferation in the XF SCC-M. Cell growth of OEC in the control and XF conditions, expressed respectively in the metabolic activity levels and the rate of culture expansion measured by high throughput cell number quantification. (B) XF SCC-M formulation performance in terms of cell metabolic activity, analysed over the passages of OEC culture. Phase contrast images of OEC morphology in the control and XF formulation. (C) Representative images showing cellular localization of CD31, vWF, VE-Cad, and Ac-LDL in standardly and SCC-grown OEC. (D) Representative flow cytometry histograms of OEC cultured in the control medium and XF SCC-M showing reactivity with EC-characteristic marker molecules (right-shifted filled black curves compared with grey lined curves of the appropriate controls) and lack of reactivity with the negative CD90 marker. (E) Representative micrographs of the tubular-like structures formed in Matrigel, along with exemplary analyses of OEC grown in EGM-2MV and XF SCC-M. Quantification of characteristic parameters of the tubular structure derived from EGM-2MV and XF SCC-M-cultured cells.

