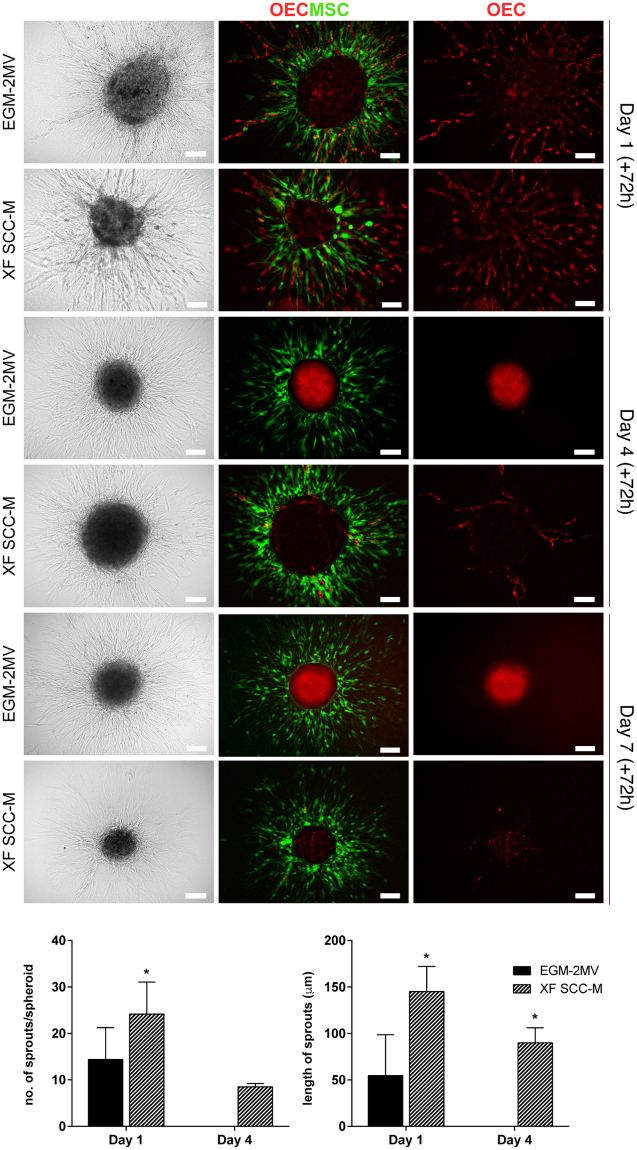
Figure 5.
Fibrin-based 3D angiogenesis assay. Representative Brightfield and fluorescence images of sprouting MSC-OEC spheroids, cultured in normal and XF conditions for periods of respectively 1, 4, and 7 days; brought under the assay conditions for 72 h. OEC were marked with DiI-Ac-LDL and MSC were labelled with a CellTracker Green Dye. Scale bars correspond to 100 μm. Graphs represent quantitative analyses of the average numbers of sprouts per spheroid and their length, respectively under normal and XF conditions (n = 7, Mann-Whitney test was used to compare the two groups).

