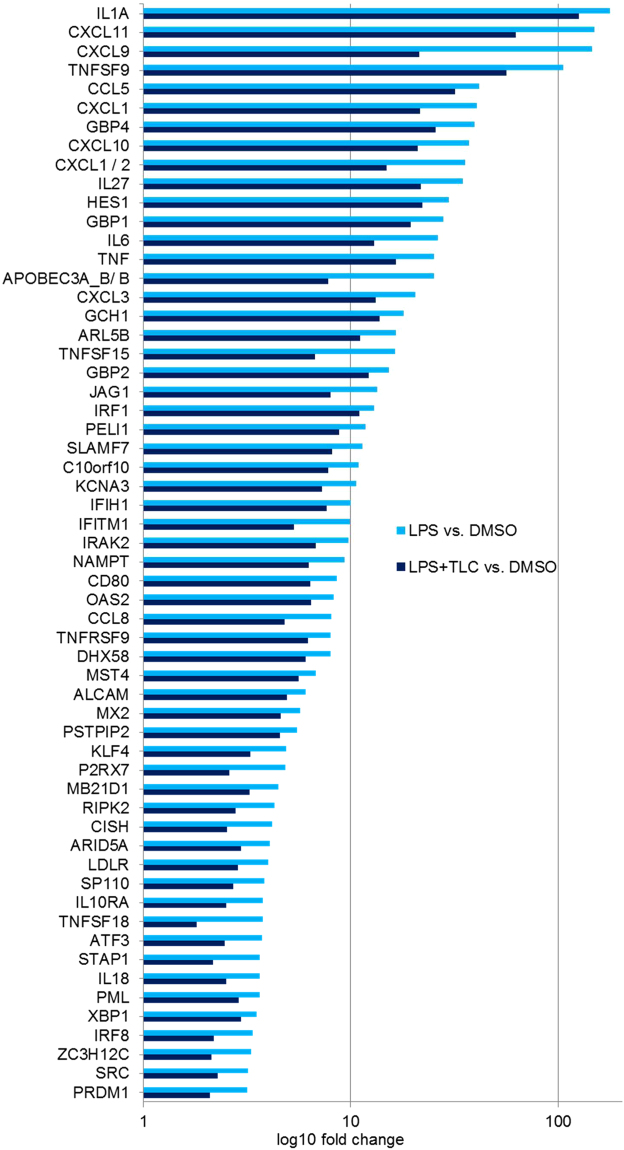
Figure 2.
LPS-induced immune regulatory genes down-regulated by TLC. Selected immune associated genes significantly increased by LPS (fold ≥ 3 and p-value ≤ 0.01) and decreased by TLC (p-value ≤ 0.05). The vertical axis shows the name of expressed genes and the horizontal axis displays the –Log10 (fold change). Transcripts are classified as having immune regulatory properties by considering information about gene and protein function (http://www.ncbi.nlm.nih.gov or http://www.uniprot.org/).

