Figure 2.
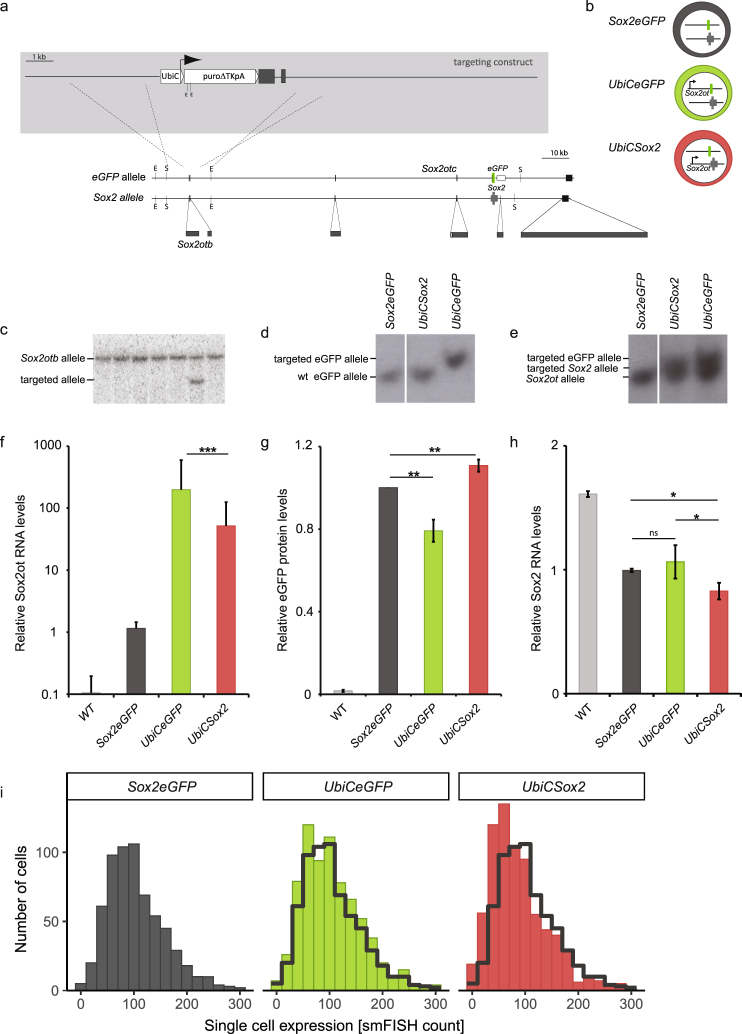
Allele-specific overexpression of endogenous Sox2otb. (a) Schematic view of the targeting strategy and targeting construct to generate allele-specific transcription of Sox2ot. R = EcoRV and S = SbfI restriction sites. (b) Illustration of the genetic possibilities after targeting the Sox2eGFP ESC line: Sox2eGFP (untargeted), UbiCeGFP (Sox2ot is expressed from the eGFP allele), or UbiCSox2 (Sox2ot is expressed from the Sox2 allele). (c) Southern blotting showing correctly recombined Sox2eGFP ESC clone using a 3′ probe (EcoRV restricted DNA). (d) and (e) Southern blot analysis showing correct targeting of the eGFP allele (UbiCeGFP) or Sox2 (UbiCSox2) allele using eGFP (d) or Sox2 (e) specific probes (SbfI restricted DNA). Full blots are shown in Supplementary Fig. S3a. (f) Sox2otb expression in Sox2eGFP, UbiCeGFP, and UbiCSox2 cells as measured by qRT-PCR. (g) eGFP expression measured by flow cytometry in Sox2eGFP, UbiCeGFP, and UbiCSox2 cells. (h) Sox2 RNA levels in Sox2eGFP, UbiCeGFP, and UbiCSox2 cells measured by qRT-PCR. (i) smFISH quantification of Sox2 RNA copies per single cell in Sox2eGFP, UbiCeGFP, and UbiCSox2 lines. The gray line depicts the distribution of Sox2 in Sox2eGFP cells. ***P value < 0.002, **P value < 0.01 *P value < 0.05. Results are from three independent experiments using (sub)clones of Sox2eGFP (n = 2), UbiCeGFP (n = 3), and UbiCSox2 (n = 2). Values are presented as mean +/− SD (g and h) or +SD (10 log scale (f)). qRT-PCR data were normalized against β-Actin, and relative levels to the levels in Sox2eGFP cells were determined. Statistical analysis was performed using the paired t-test, except for flow cytometry results (Wilcoxon signed-rank test) and smFISH results (Mann-Whitney U test).

