Figure 2.
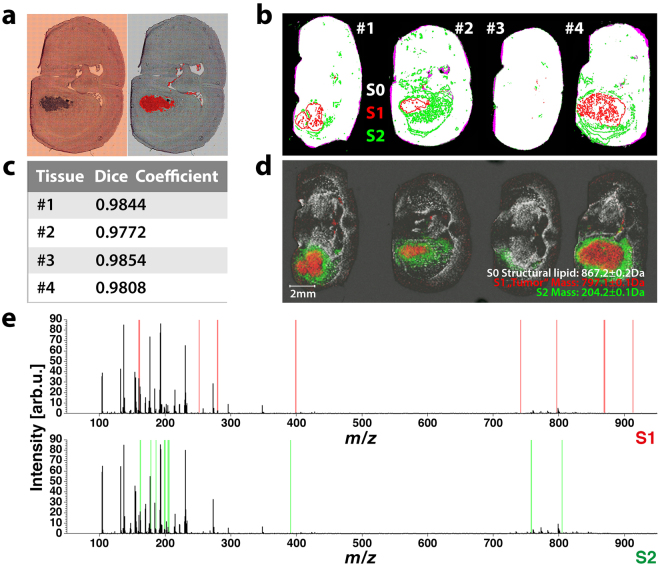
FTIR-based identification of tumor lesions in xenografted CD1 nu/nu mice. Brains of four CD1 nu/nu mice (#1 to #4) were inoculated with 1 × 10⁵ human U87-MG glioblastoma cells, and organs were harvested 5–6 weeks later. Subsequently, we prepared adjacent 8 µm coronal brain sections for FTIR and MALDI-MS image acquisition. FTIR data acquired from cryosections of all four mouse brain samples were simultaneously disaggregated by k-means++ segmentation (k = 10) to identify intra- and inter-specimen relationships. (a) By comparing the depicted spatial contours belonging to a given index in a single brain section (left panel) to its corresponding H&E stain on gold (right panel), it becomes possible to identify tumor-associated segments in all four specimen, because they share the same index. (b) Binary images derived from FTIR data and microscopic images of subsequent sections used for MS acquisition are automatically registered. The resulting fusion images (white = matching areas, magenta = non-matching areas) are overlaid by contours of two segments (S1, red & S2, green) present in all observed specimen. (c) The quality of registration is further evaluated using the dice similarity coefficient, which demonstrates an overlap of >97% between all transformed binary FTIR images and the binary images used for MSI measurement (d) Extracting only mass spectra that lie within the transformed spatial contours of S1 and S2, enables identification of m/z-values with matching distribution patterns (m/z 797.1 tumor-specific signal in S1, m/z 204.2 signal-specific for the expanded tumor margin S2) by (e) means of feature selection using the area between the empirical receiver operating characteristic (ROC) curve and the random classifier slope. For both, S1 and S2, ten conspicuous features (highlighted in red for S1 and green for S2) were calculated.

