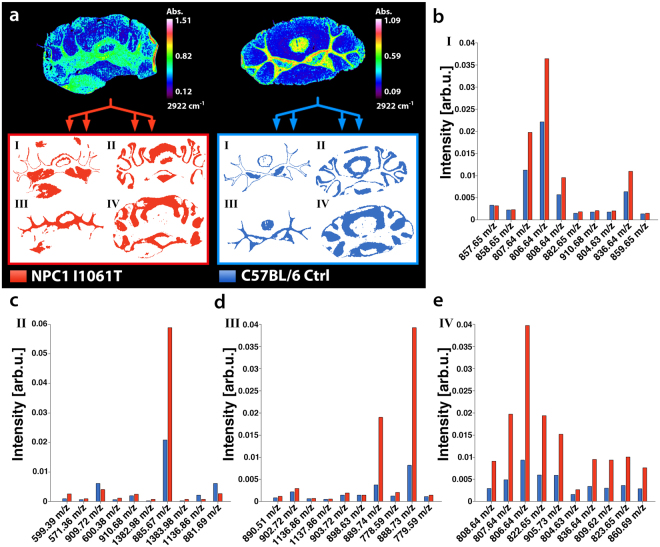
Figure 4.
Comparison of MS lipid/metabolite signatures derived from FTIR-segmented NPC1 and Control mouse brains. (a) FTIR images (exemplary presentation of the absorption at 2922 cm−1) were recorded for coronal cerebellar sections of NPC1 I1061T knock-in and C57BL/6 control (Ctrl) mice and subsequently divided into four segments (I-IV) of maximum data similarity by means of k-means++ clustering. Comparison to the Allen Brain Reference Atlas39 suggests the morphological identity of three FTIR-derived segments, namely granule cell layer (II), fiber tracts (III) and molecular layer (IV). The spatial contours reflecting distinct cell morphologies were automatically transferred to MS images, in order to enable comparison between the MS lipid/metabolite profiles of NPC1 and Ctrl mice, guided to the obtained infrared segments. (b–e) Ten distinct m/z features allowing discrimination between healthy and diseased mice were identified using t-test based feature extraction revealing segment and disease-selective changes.

