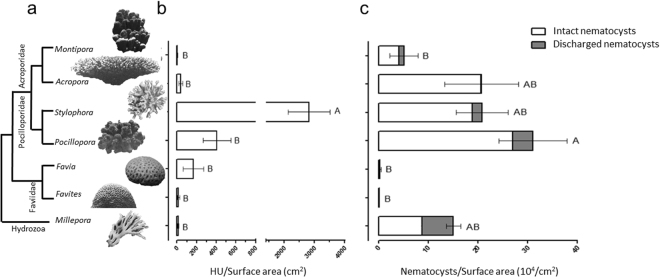
Figure 1.
Inter-species variability in hemolytic activity and nematocyst density. (a) Schematic phylogeny of the seven studied reef-building corals77,78. The images are not shown to scale. (b) Hemolytic activity in tissue extracts of the seven corals, normalized to surface area. HU-Hemolytic Unit, defined as the amount of hemolytic activity causing 50% hemolysis of human red blood cells in a standard, 500 μl reaction (see materials and methods). (c) Nematocyst density in the tissue, normalized to surface area. Data in panels C and D are the mean ± SE of one fragment (branch tip) each from 5 different colonies.

