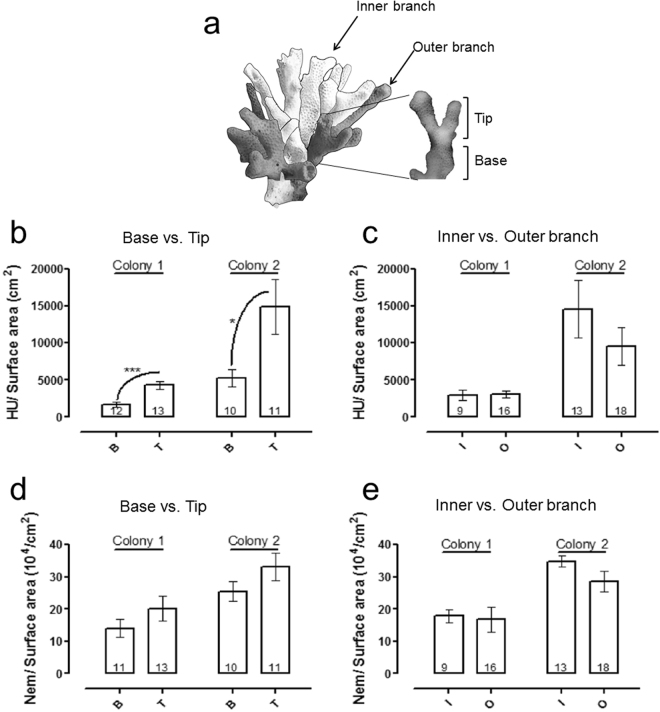
Figure 2.
Intra-colonial differences in toxicity in Stylophora. (a) A skeleton of Stylophora, schematically illustrating the location of the inner (white) and outer (grey) branches, as well as the difference between branch base and tip. (b,c) Comparison of the hemolytic activity, normalized to surface area, between fragments from different locations in the two Stylophora colonies. (d,e) same as (b), but for number of nematocysts. Numbers below the bars represent number of replicates, error bars indicate mean ± SE. Asterisks indicate significant differences (p = 0.0003 for colony 1 and p = 0.0293 for colony two, using Tukey-Kramer HSD test).

