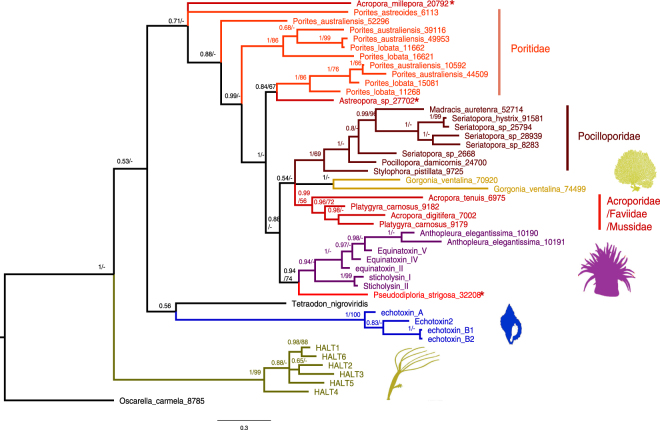
Figure 6.
Phylogeny of actinoporins and actinoporin-like proteins in cnidarians. A Bayesian tree is shown, with numbers on the nodes representing posterior probabilities and Maximum Likelihood bootstrap values (when above 50%). Schematic images represent (from top to bottom) gorgonians, sea anemones, molluscs and hydra. All of the sequences not originating from these animals are from scleractinian corals, and are colored based on the clades/families mentioned in the text (*represents sequences from Acroporidae and Mussidae that do not cluster with the other sequences from this group, as described in the text). The sequences for the proteins in this tree can be found in the Supplementary fasta file.

