Figure 3.
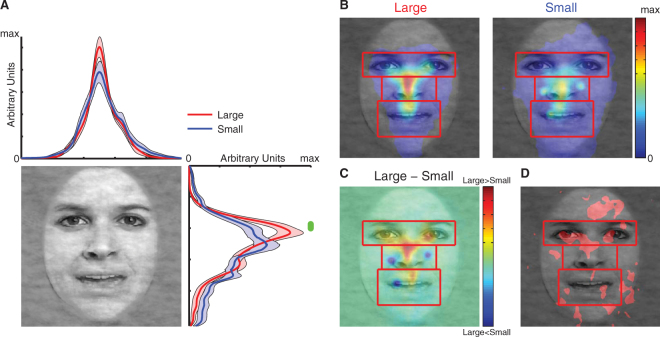
Fixation density comparisons between large vs. small faces. (A) 2D probability distribution of fixation densities. Shaded area denotes one SEM across subjects. The green bar illustrates the points with significant difference between large vs. small faces (paired two-tailed t-test, P < 0.05, FDR corrected). (B) Fixation density probability maps for large vs. small faces. A common scale (in arbitrary units) is used for both plots. Red rectangles denote the ROIs used for analysis (not shown to subjects). (C) A difference map of fixation density. Red: large > small. Blue: small > large. (D) A statistical map. Significant differences in fixation density between face sizes are shown in red (two-tailed paired t-test at each pixel, P < 0.05 uncorrected). Face images were constructed from44.

