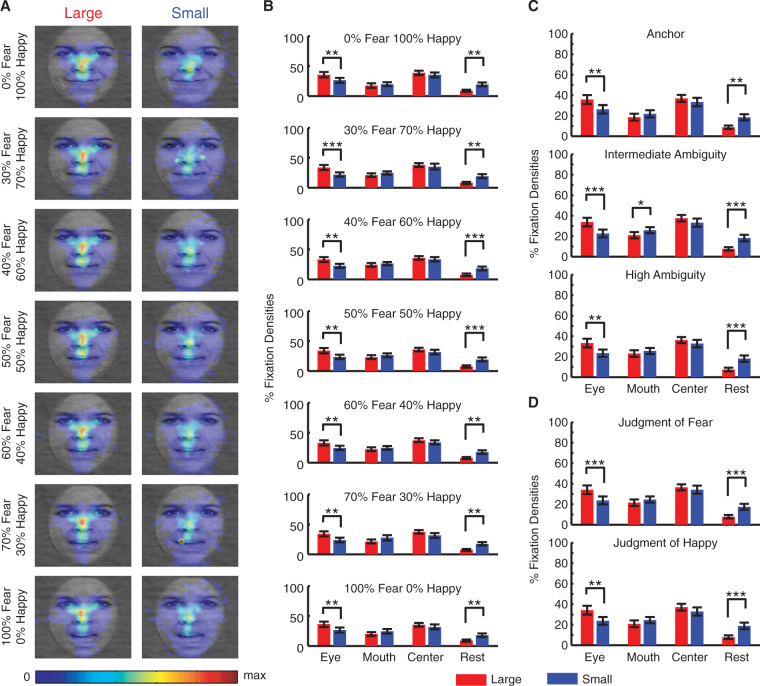
Figure 6.
Fixation densities as a function of stimulus level and behavioral judgment. (A) Fixation density maps for each morph level. Conventions as Fig. 3B. Face images were constructed from44. (B) Fixation density for each morph level. (C) Fixation density for each ambiguity level. (D) Fixation density for each behavioral judgment. Error bars denote ± SEM across subjects. Asterisks indicate significant difference using two-tailed paired t-test. *P < 0.05, **P < 0.01, and ***P < 0.001.

