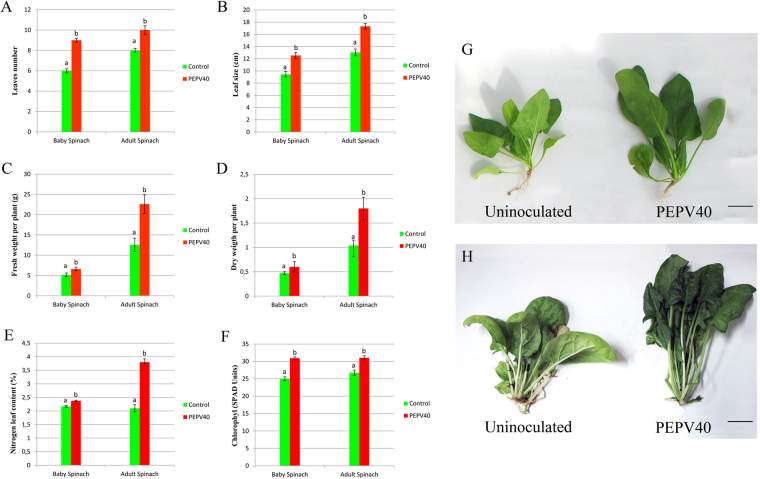
Figure 4.
Spinach growth promotion in greenhouse experiments. Number of leaves (A) and size (B), fresh (C) and dry (D) weight and nitrogen (E) and chlorophyll (F) contents. Bars indicate the standard error. Histogram bars marked with the same letter in each treatment are not significantly different from each other at P = 0.05 according to Fisher’s Protected LSD (Least Significant Differences). Baby spinach (G, bar 270 mm) and adult spinach (H, bar 270 mm) from microcosm experiment.

