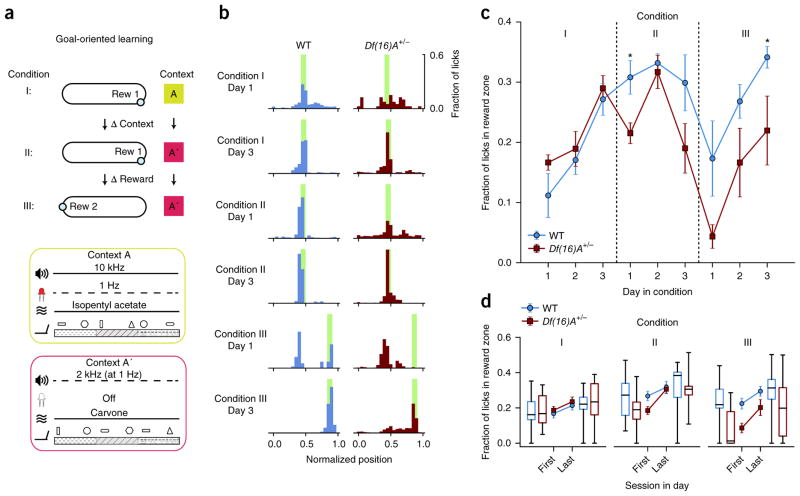
Figure 1.
Differences in learning performance between Df(16)A+/− and WT mice in GOL task. (a) The three conditions of the GOL task. Mice spend 3 d in each condition. Contexts A and A′ are composed of different auditory, visual, olfactory and tactile cues (Online Methods), varied between Condition I and Condition II. The location of the hidden reward (blue circles, Rew 1 and Rew 2) is switched between Condition II and Condition III. Water-deprived mice trained to run on a linear treadmill were introduced to a novel environmental context (Context A) consisting of a feature-rich fabric belt and specific background with nonspatial odor, tones and blinking light patterns (Context A) on the first day of the experiment. Operant water rewards were available at a single unmarked location on the belt (Rew 1 in Conditions I and II; Rew 2 in Condition III); if the mouse licked in the correct location they received a water reward, but no water was administered if they did not lick in the reward location or if they licked outside the reward location (Condition I, 3 d and 3 sessions per d). The time of each lick as well as the position of the mouse on the treadmill were recorded both to determine when to deliver water rewards and to provide a readout of learning. To test the ability of mice to adjust to changes in the task conditions, mice were exposed to an altered context (Context A′: same sequence of belt materials, shuffled local cues, different nonspatial odor, tone and light; Online Methods), while maintaining the same reward location relative to the belt fabric sequence (Condition II, 3 d and 3 sessions per d). During the last part of the task, the location of the hidden reward was changed while maintaining the familiar context from Condition II (Condition III, 3 d and 3 sessions per d). (b) Example histograms of lick counts by position for a WT mouse (blue) and a Df(16)A+/− mouse (red) on the first and last days of each condition. Green bars, reward locations. As the mice learned the reward location they switched from exploratory licking along the entire belt to focused licking only at the reward location, suppressing licking at other locations. Hence licking became increasingly specific for the reward location. (c) Learning performance of WT and Df(16)A+/− mice based on fraction of licks in the reward zone (n = 6 mice per genotype, main effects described in Results section, post hoc tests with Benjamini-Hochberg correction, Condition I, two-way mixed-design RM ANOVA, main effect of day: F2,20 = 28.235, P < 0.0001; Condition II, two-way mixed-design RM ANOVA, main effect of genotype: F1,10 = 6.297, P = 0.031; main effect of day: F2,20 = 4.076, P = 0.033; Day 1: P = 0.015 ; Condition III, two-way mixed-design RM ANOVA, main effects of day: F2,20 = 15.762, P < 0.0001; main effect of genotype: F1,10 = 7.768, P = 0.019; day × genotype interaction P = 0.932: n.s.; Day 3: P = 0.022). Error bars represent s.e.m. (d) Learning performance for WT and Df(16)A+/− mice on the first and last session of each day by Condition. Across all conditions, both genotypes performed better at the end of the day. During Condition I, WT and Df(16)A+/− mice performed similarly throughout the day (main effects described in Results section), while in Condition II, Df(16)A+/− mice were more impaired at the start of the day (post hoc tests with Benjamini-Hochberg correction: two-way mixed-design RM ANOVA, main effect of session: F1,10 = 40.506, P < 0.0001; genotype × session interaction: F1,10 = 6.404, P = 0.030; main effect of genotype, P = 0.213: n.s.), and in Condition III they additionally never reached WT levels (post hoc tests with Benjamini-Hochberg correction: two-way mixed-design RM ANOVA, main effect of genotype: F1,10 = 6.433, P = 0.030; main effect of session: F1,10 = 53.237, P < 0.0001; genotype × session interaction P = 0.085: n.s.). Center line in box plot is the median, the top and bottom of the box denote the 1st and 3rd quartile of the data, respectively, and the whiskers mark the full range of the data. *P < 0.05.

