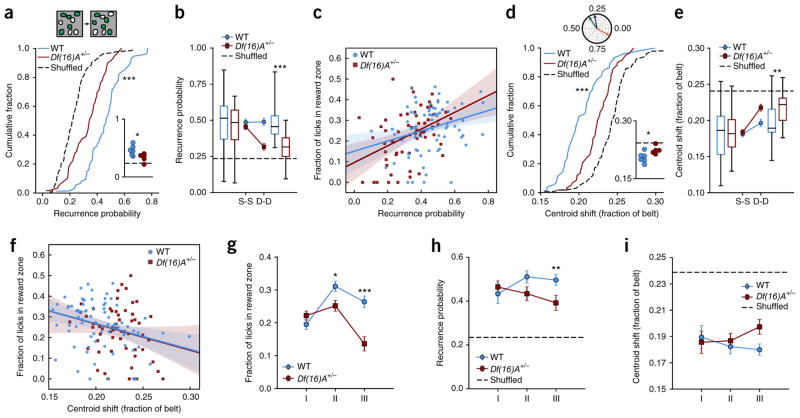
Figure 3.
Disrupted stability of place cell population in Df(16)A+/− compared to WT mice. (a) Top: example of place cell recurrence. In a given field of view, a subset of all cells has significant spatial tuning each day (place cells, green). The overlap in this population is the recurrence probability (40% in this example). Bottom: distribution of recurrence fractions from day to day for WT and Df(16)A+/− mice for all sessions (dotted line is cell-identity shuffle distribution: WT: 0.456 ± 0.015, n = 74 sessions, Df(16)A+/−: 0.327 ± 0.017, n = 59 sessions, shuffle: 0.229 ± 0.009, n = 133 sessions; WT vs. shuffle: Welch’s t test, t = 12.64, P < 0.0001; Df(16)A+/− vs. shuffle: Welch’s t test, t = 5.124, P < 0.0001; WT vs. Df(16)A+/−: independent samples t test, t = 5.72, P < 0.0001) and aggregated by mouse (inset; horizontal dotted line is cell-identity shuffle: WT vs. Df(16)A+/−: independent samples t test, t = 2.611, P = 0.028). (b) Mean fraction of cells that reoccur as place cells from session to session (S-S) or day to day (D-D) for WT and Df(16)A+/− mice (dotted line is mean place cell fraction; linear mixed-effects model with genotype and elapsed time as fixed effects and mouse ID as random effect; genotype × elapsed time interaction: F1,145.754 = 5.858, P = 0.017; post hoc analysis, WT vs. Df(16)A+/−, S-S: F1,10.659 = 0.664, P = 0.433; D-D: F1,10.086 = 20.534, P = 0.001, significant after Benjamini-Hochberg correction). (c) Correlation of place cell recurrence with performance throughout the task. Solid lines, linear regression fit; shaded regions, 95% confidence intervals calculated from bootstrap resampling (Pearson’s correlation coefficient, WT: 0.288, P = 0.013; Df(16)A+/−: 0.416, P = 0.001; WT correlation vs. Df(16)A+/− correlation, Fisher z-transformation of correlations, general linear model (GLM), univariate ANOVA: genotype × z recurrence probability interaction: F1,132 = 0.599, P = 0.440; alternatively: linear mixed effects model with genotype as fixed effect, recurrence probability as covariate and mouse ID as random effect: genotype × recurrence probability interaction: F1,129 = 1.083, P = 0.300; recurrence effect: F1,129.000 = 18.197, P < 0.0001). (d) Top: preferred spatial tuning is represented as vectors where the angle is the position on the treadmill of maximal activity. Across three sessions (green, blue and orange lines), spatial preference is generally stable (green to blue sessions), though salient events or changes to the environment can induce remapping (blue to orange sessions). The centroid shift is the angle between these vectors, represented as the fraction of the belt. Bottom: distribution of mean centroid shift from day to day per session (dotted line is cell-identity shuffled distribution: WT: 0.204 ± 0.003, n = 74 sessions, Df(16)A+/−: 0.224 ± 0.003, n = 59 sessions, shuffle: 0.242 ± 0.002, n = 133; WT vs. shuffle: independent sample t test, t = −9.42, P < 0.0001; Df(16)A+/− vs. shuffle: independent samples t test, t = −4.25, P < 0.0001; WT vs. Df(16)A+/−: independent samples t test, t = −4.71, P < 0.0001) and aggregated by mouse (inset; horizontal dashed line is cell-identity shuffle; independent samples t test, t = 2.58, P = 0.0295). (e) Mean centroid shift from S-S or D-D for WT and Df(16)A+/− mice (dotted line is mean centroid shift, linear mixed-effects model with genotype and elapsed time as fixed effects and mouse ID as random effect, genotype × elapsed time interaction: F1, 38,078.993 = 15.042, P < 0.0001; post hoc analysis, WT vs. Df(16)A+/−, S-S: F1,11.137 = 0.303, P = 0.593; D-D, F1,10.577 = 8.724, P = 0.014, significant after Benjamini-Hochberg correction). (f) Correlation of mean day-today stability with performance throughout the task. Solid line and shaded regions as in d (Pearson’s correlation coefficient, WT: −0.306, P = 0.008; Df(16)A+/−: −0.218, P = 0.097; WT correlation vs. Df(16)A+/− correlation, Fisher z transformation of correlations, GLM, univariate ANOVA: genotype × R stability–probability interaction: F1,132 = 0.268, P = 0.605; linear mixed effects model with genotype as fixed effect, centroid shift as covariate and mouse ID as random effect: genotype × centroid shift: F1,133.000 = 0.001, P = 0.982; centroid shift: F1,133.000 = 8.804, P = 0.004). In b and e, center line in box plot is the median, the top and bottom of the box denote the 1st and 3rd quartile of the data, respectively, and the whiskers mark the full range of the data. (g–i) Task performance and population stability by genotype follow similar trajectories across conditions. Error bars represent s.e.m. of total number of sessions by mouse. Bonferroni-corrected post hoc tests comparing genotype per condition. (g) Fraction of licks in the reward zone by condition (two-way ANOVA, main effect of genotype P < 0.0001, main effect of condition P < 0.0001, genotype × condition interaction: P < 0.0001; post hoc comparisons: Condition II, P = 0.011; Condition III, P < 0.001). (h) Recurrence probability by condition (linear mixed-effects model with condition and genotype as fixed effects and mouse as random effect, genotype effect: F1,11.084 = 7.293, P = 0.021, genotype × condition interaction: P = 0.083; post hoc comparisons: Condition III, P = 0.004). (i) Mean centroid shift by condition (linear mixed-effects model as before, genotype effect: F1,10.107 = 6.771, P = 0.026). *P < 0.05, **P < 0.01, ***P < 0.001.

