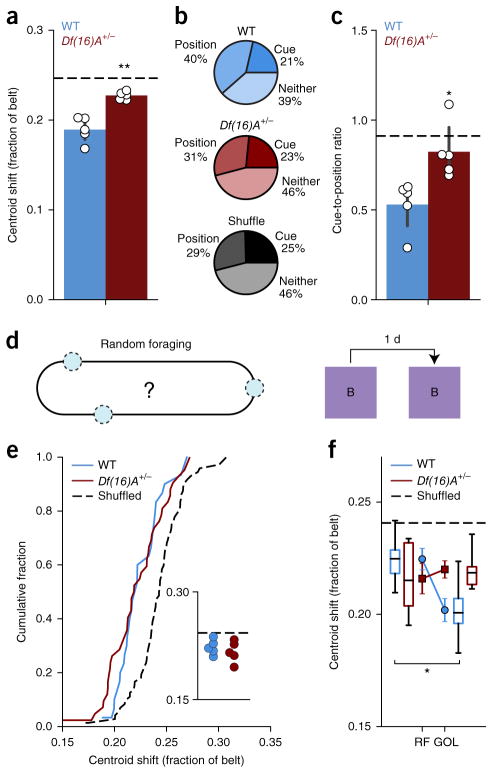
Figure 4.
Lack of context change and task-dependent stability of spatial maps in Df(16)A+/− mice. (a) Mean centroid shift from the last day of Condition I to the first day of Condition II (WT: 0.195 ± 0.008, n = 6; Df(16)A+/−: 0.227 ±0.002, n = 5; independent samples t test: t = −3.626, P = 0.0055). Horizontal dashed line represents shuffled data. Error bars represent s.e.m. for mice. (b) Fraction of all cells classified as place-preferring (position), cue-preferring (cue) or neither (pooled across mice) for WT, Df(16)A+/− and shuffled data (Pearson chi-square test: ±2 = 85.7776, P < 0.0001). (c) Ratio of the number of cue-preferring to place-preferring cells per mouse for WT mice, Df(16)A+/− mice (independent samples t test: t = −3.172, P = 0.0131) and shuffled data (horizontal dashed line). Error bars represent s.e.m. for mice. (d) Schematic of RF task. Rewards (blue circles) are presented randomly throughout the belt in the same context (Context B): same belt fabric sequence but different auditory, visual, olfactory and tactile cues. (e) Distribution of mean centroid shift per session from day to day during RF task (dotted line is cell-identity shuffled distribution; WT: 0.222 ± 0.004, n = 30 session pairs; Df(16)A+/−: 0.220 ± 0.004, n = 42 session pairs; shuffle: 0.244 ± 0.002, n = 72; WT vs. shuffle: independent sample t test: t = −5.05, P < 0.0001; Df(16)A+/− vs. shuffle: Welch’s t test, t = −5.12, P < 0.0001; WT vs. Df(16)A+/−: independent samples t test: t = 0.451, P = 0.653) and aggregated by mouse (inset; horizontal dashed line is cell-identity shuffle; WT vs. Df(16)A+/−: independent samples t test: t = 0.799, P = 0.448). (f) Comparison of mean centroid shift per mouse in the RF and GOL tasks (GOL data replotted from Fig. 3e; linear mixed-effects model, genotype × task interaction: F1,19.471 = 4.316, P = 0.051; effect of task: F1,19.471 = 4.924, P = 0.039; post hoc analysis: WT, GOL vs. RF: F1,11.285 = 10.472, P = 0.008, significant after B Benjamini-Hochberg correction; Df(16)A+/−, GOL vs. RF: F1,8.562 = 0.006, P = 0.940). In box plots, center line represents the median, the top and bottom of the box denote the 1st and 3rd quartile of the data, respectively, and the whiskers mark the full range of the data. *P < 0.05, **P < 0.01

