FIG 1.
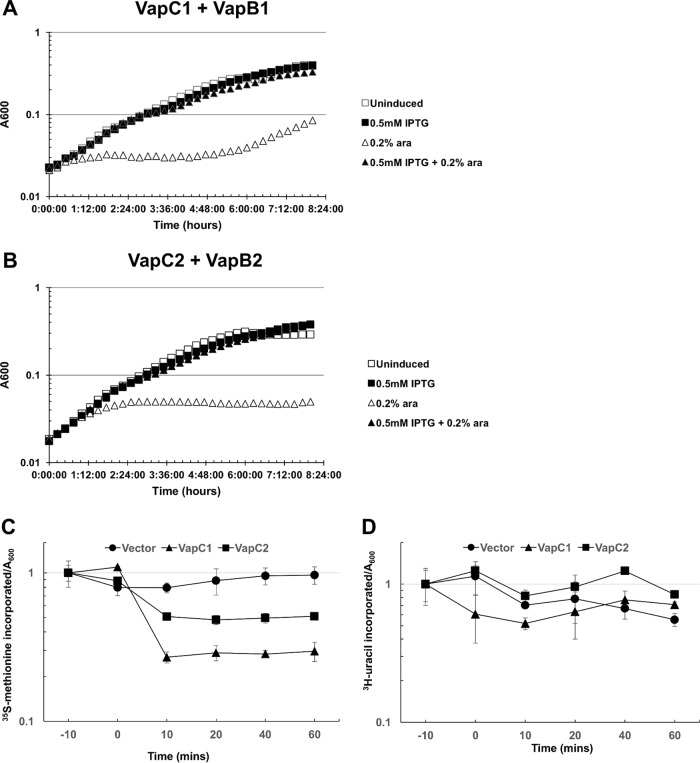
VapC1NTHi and VapC2NTHi slow cell growth by inhibiting protein synthesis. (A) The growth rates of E. coli Top10 cells carrying pBAD-VapC1 and pJSB31-VapB1-sfGFP under different induction conditions were compared using the bacterial growth curve assay as described in Materials and Methods. Cultures were grown in M9 medium containing 0.2% glucose and appropriate antibiotics. pBAD-VapC1 was induced with 0.2% l-arabinose (ara), and pJSB31-VapB1-sfGFP was induced with 0.5 mM IPTG. (B) The growth rates of E. coli Top10 cells carrying pBAD-VapC2 and pJSB31-VapB2-sfGFP under different induction conditions were compared as described for panel A. (C and D) Rates of translation (C) and transcription (D) were compared between E. coli Top10 cells carrying the pBAD empty vector, pBAD-VapC1, or pBAD-VapC2 by pulse labeling with [35S]methionine (C) or [3H]uracil (D) according to the metabolic labeling protocol described in Materials and Methods. Induction occurred by addition of 0.2% l-arabinose at 0 min. Counts per minute were normalized by use of the A600 value for each time point and plotted relative to the measurement at −10 min. Data are averages for two biological replicates, and error bars represent standard deviations.

