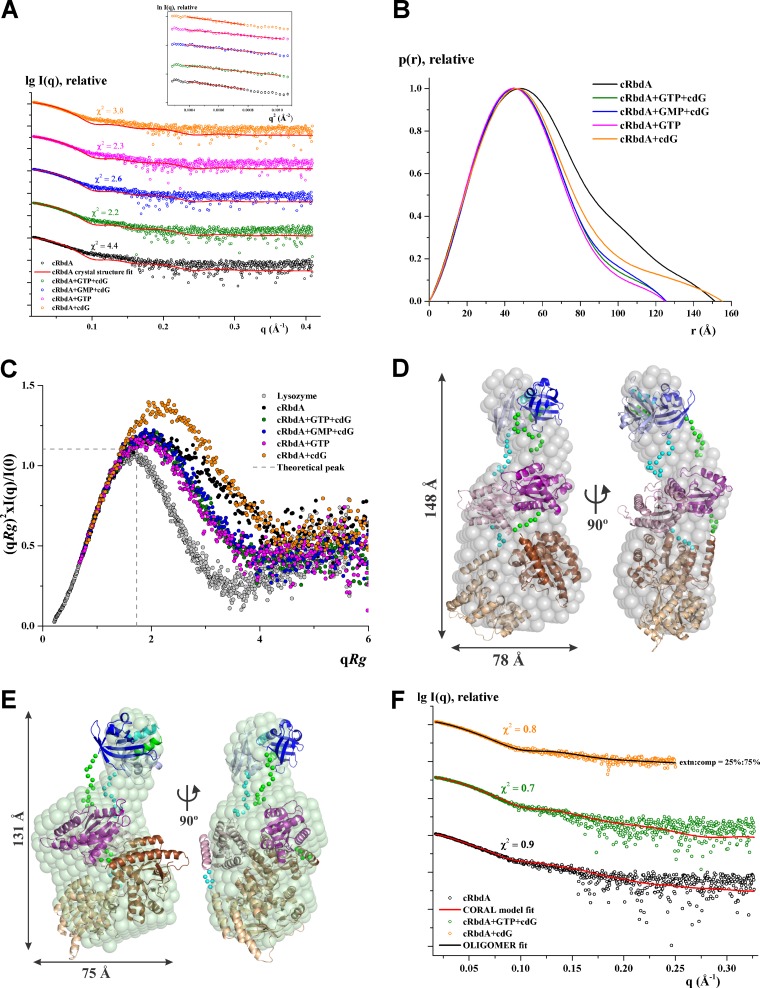
FIG 7.
Solution X-ray scattering studies of cRbdA with ligands. (A) Experimental scattering patterns (○) and calculated scattering profiles (lines) of crystal structure dimers of cRbdA alone (black) and in complex with GTP and c-di-GMP (cdG), GMP and cdG, GTP, and cdG. (Inset) Guinier plots show linearity at all concentrations used, indicating no aggregation. The scattering profiles were offset, for clarity, by applying arbitrary scale factors. (B) Overlapping of pair-distance distribution function P(r) of cRbdA and its ligand complexes. cRbdA complexes with GTP and cdG, GMP and cdG, and GTP have similar profiles; however, cRbdA with cdG has an extended tail. (C) Normalized Kratky plot of cRbdA (black) compared to its complexes and the compact globular lysozyme (gray), with a peak (gray dashed line) representing the theoretical peak and assuming an ideal Guinier region of a globular particle. The scattering pattern of cRbdA and its complexes exhibits a broad bell-shaped profile shifted toward the right with respect to standard globular proteins, indicating the presence of motion in the protein. (D) Averaged and filtered envelope (gray) from 20 independent ab initio reconstructions created by use of DAMMIF superimposed onto a cartoon representation of the CORAL model with an extended conformation for cRbdA, with the PAS domain in blue, the GGDEF domain in purple, and the EAL domain in brown. The second subunit is colored in lighter shades. The linker regions modeled between the domains are shown as green and cyan spheres for the subunits. Front (left) and side (right) views are displayed. (E) Averaged and filtered ab initio low-resolution shape of cRbdA in the presence of GTP and c-di-GMP (green) superimposed on the compact conformation generated from CORAL. (F) Fitting of the CORAL model (red lines) to the experimental scattering patterns (○) for cRbdA alone (black) and with GTP and c-di-GMP (green). The theoretical scattering curve for the mixture of 75% compact and 25% extended conformations of cRbdA dimers (black line) calculated using the OLIGOMER program fits the experimental scattering pattern of cRbdA with cdG (orange), with a χ2 value of 0.8.

