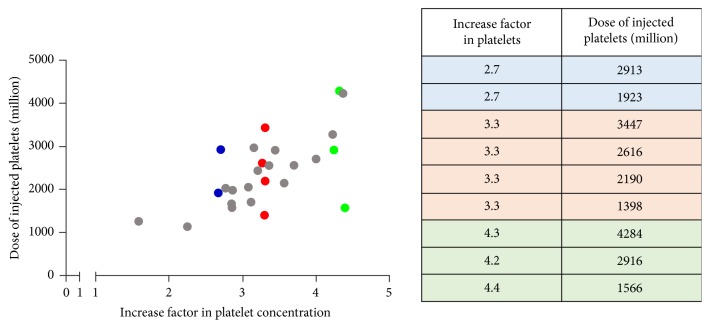
Figure 1.
Graphic representation of different PRP preparations (n = 26) with increase factor in platelets (x axis) and dose of injected platelets (y axis). PRP prepared with the same technique can lead to preparations with similar increase factor (IF) in platelets (blue, red, and green points, resp., present IF of 2.7, 3.3, and 4.3), but displaying highly variable dose of injected platelets.

