. 2017 Dec 12;16:1297–1307. doi: 10.17179/excli2017-491

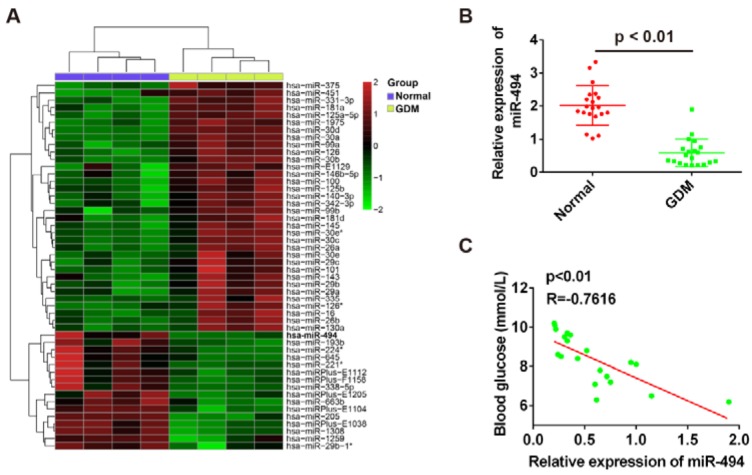
Figure 1. MiR-494 is significantly down-regulated in blood of GDM patients. (A) Differentially expressed miRNAs were analyzed using significance analysis of microarrays method. Data was retrieved from GEO dataset, with the accession number GSE19649. Expression values are represented in shades of red and green indicating expression above and below the median expression value across all samples. (B) The expression of miR-494 was measured by qRT-PCR in blood from 20 paired GDM women and healthy women, P < 0.01 vs the normal group. (C) Correlation between miR-494 level and blood glucose determined by Spearman correlation analysis (R = -0.7616, P < 0.01).

Figure 1