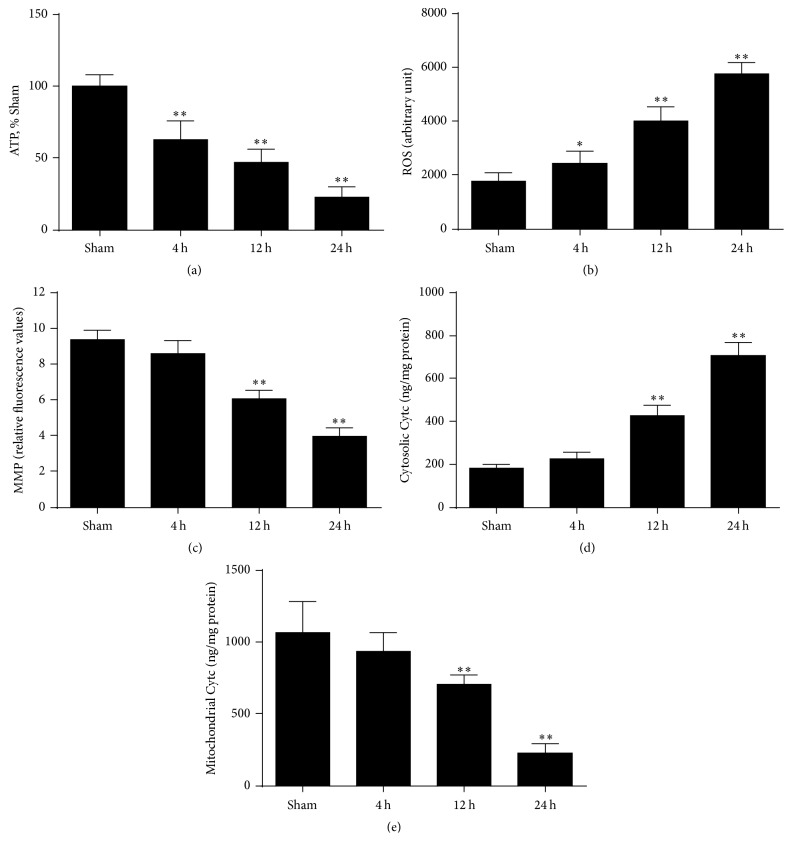
Figure 3.
Mitochondrial function tests were measured in the ischemic brain at 4 h, 12 h, and 24 h after ROSC. (a) Brain adenosine triphosphate (ATP) levels. (b) Brain reactive oxygen species (ROS) production. (c) Brain mitochondrial membrane potential (MMP) levels. (d) Cytosolic cytochrome c and (e) mitochondrial cytochrome c levels. n = 6. Data are represented as mean ± SD. ∗P < 0.05, ∗∗P < 0.01 versus sham.

