Figure 1.
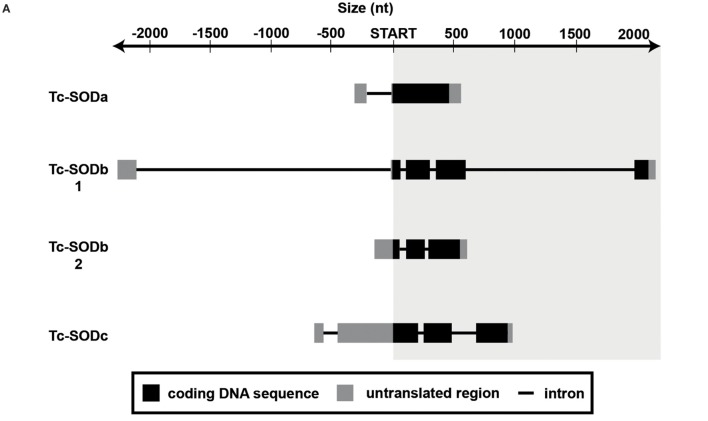
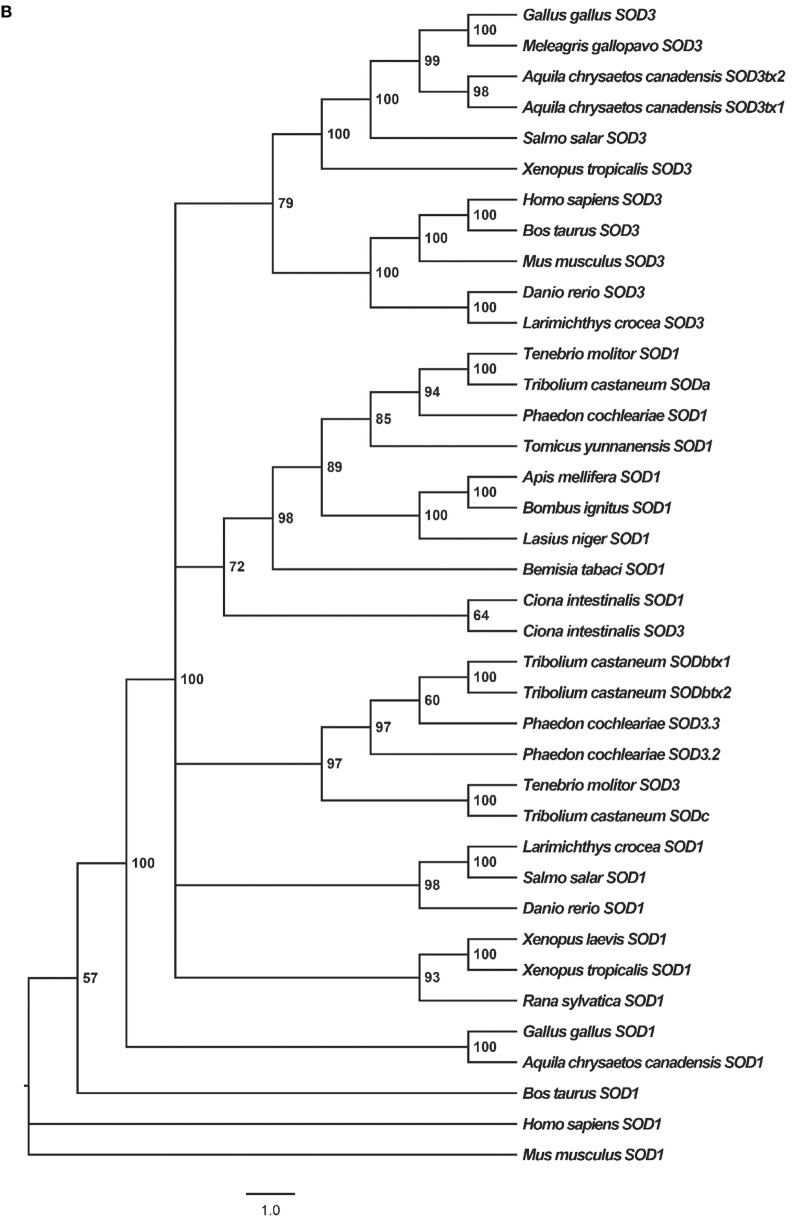
Gene architecture and phylogeny. (A) Arrangement of introns and exons in the studied sod isoforms. Exons are depicted as boxes, introns as black lines. For each gene, the coding sequence is indicated in black, the untranslated regions in grey. (B) Phylogenetic relationships among sod1 and sod3 of various organisms, reconstructed on the basis of cDNA sequences and using Bayesian Inference (BI) (arithmetic mean = −16,649.04; harmonic mean = −16,682.86) method. Posterior probability values higher than 50% are indicated on each node. The scale for branch length (1.0 substitution/site) is shown below the tree. NCBI Reference IDs for the considered sequences are available in Table S2 in Supplementary Material.


