
Figure 3.
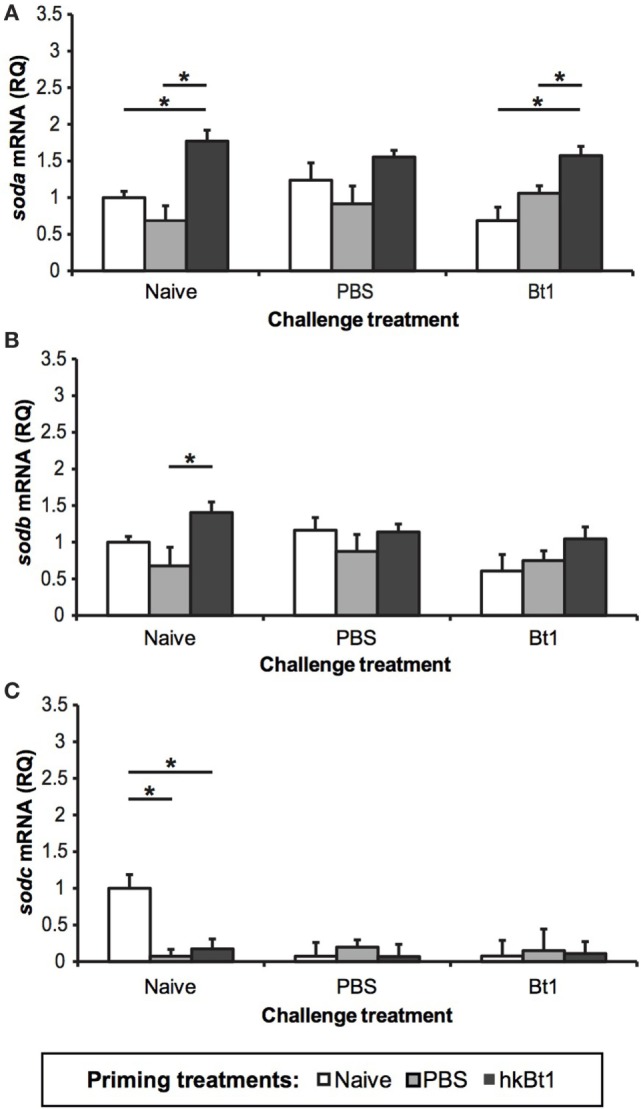
Expression of tc-soda (A), tc-sodb [both transcripts, (B)], and tc-sodc (C) in all the priming/challenge combinations 1-day post-infection. The results are reported as mean of three independent experiments ± SE. Asterisk: significant differences according to Student–Newman–Keuls t-test with respect to priming treatments within challenge treatment (p < 0.05).