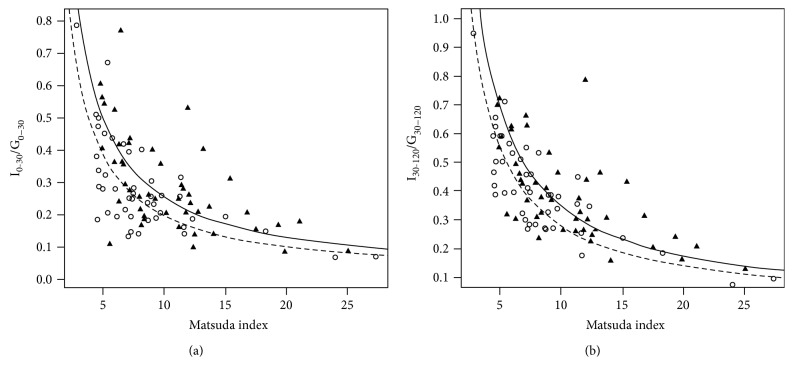
Figure 1.
The hyperbolic relationship between I0–30/G0–30 and I30–120/G30–120 and Matsuda index in healthy group in which the healthy subjects were divided into four groups according to the quartiles of SVR. (a) The hyperbola of I0–30/G0–30 versus Matsuda index in quarter 4 (solid line and triangles, intercept = 0.435, regression R 2 = 0.401) was to the right of that in quarter 1 (dashed line and circles, intercept = 0.345, regression R 2 = 0.557); the lines of quarter 4 versus quarter 1: t statistic = 2.65, P = 0.01. (b) The hyperbola of I30–120/G30–120 versus Matsuda index in quarter 4 (solid line and triangles, intercept = 0.724, regression R 2 = 0.503) was to the right of that in quarter 1 (dashed line and circles, intercept = 0.848, regression R 2 = 0.721); the lines of quarter 4 versus quarter 1: t statistic = 2.91, P = 0.005.

