Figure 1.

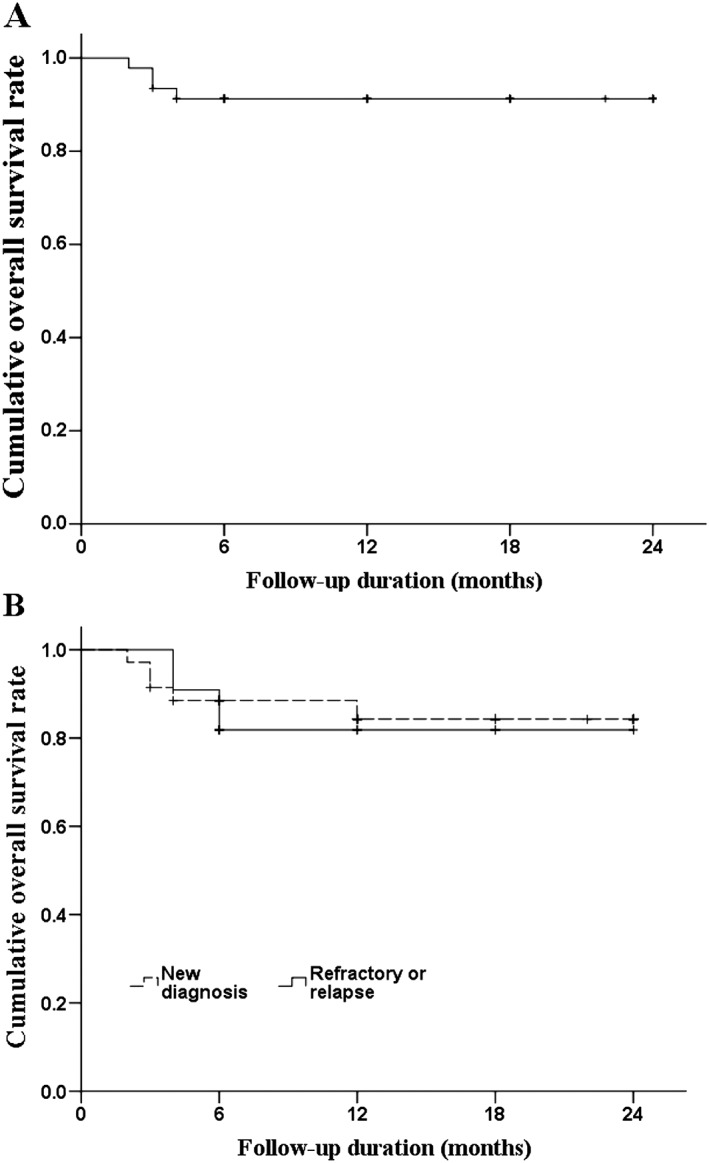
Kaplan‐Meier curves of OS. A, OS of all patients. B, OS of patients by disease state. The log‐rank test found no difference between newly diagnosed patients and those who relapsed (P = .249). Abbreviations: OS, overall survival

Kaplan‐Meier curves of OS. A, OS of all patients. B, OS of patients by disease state. The log‐rank test found no difference between newly diagnosed patients and those who relapsed (P = .249). Abbreviations: OS, overall survival