
Figure 1.
Kaplan‐Meier curves of OS. A, OS of all patients. B, OS of patients by disease state. The log‐rank test found no difference between newly diagnosed patients and those who relapsed (P = .249). Abbreviations: OS, overall survival
Official websites use .gov
A
.gov website belongs to an official
government organization in the United States.
Secure .gov websites use HTTPS
A lock (
) or https:// means you've safely
connected to the .gov website. Share sensitive
information only on official, secure websites.
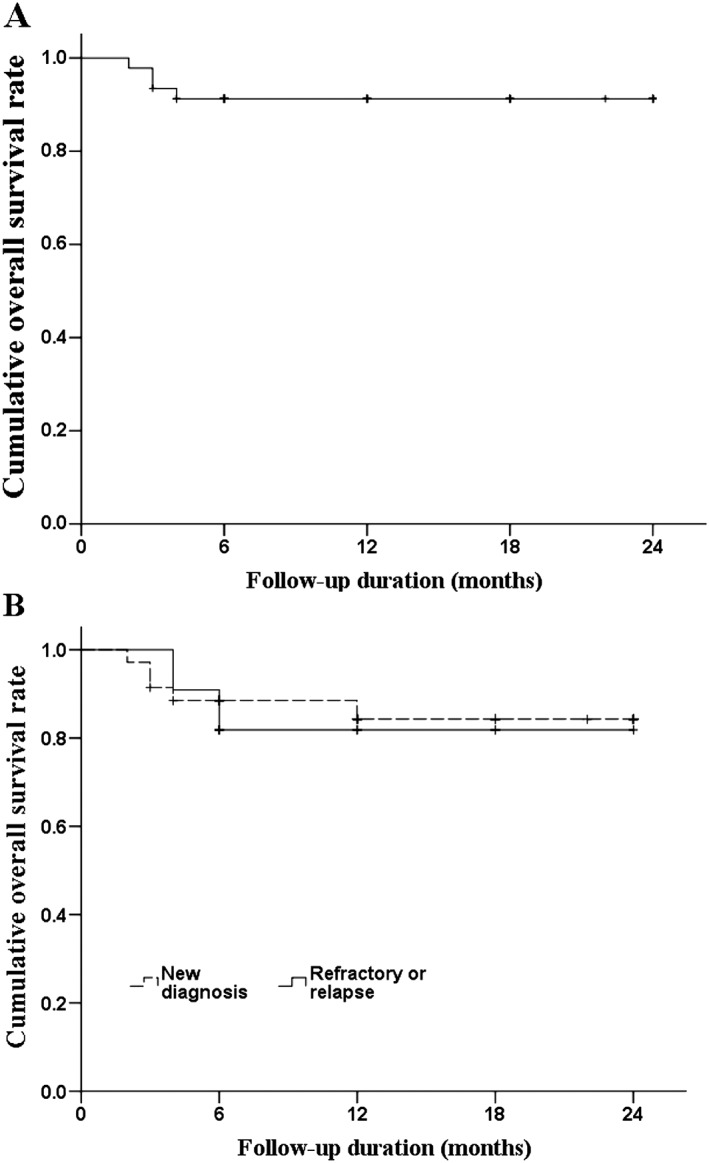
Kaplan‐Meier curves of OS. A, OS of all patients. B, OS of patients by disease state. The log‐rank test found no difference between newly diagnosed patients and those who relapsed (P = .249). Abbreviations: OS, overall survival