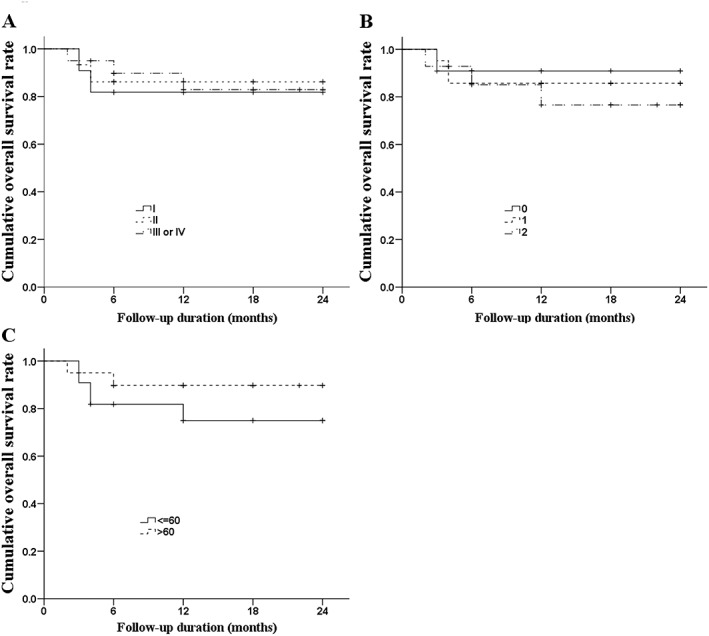
Figure 3.

Kaplan‐Meier curves of OS. A, OS by stage of disease; B, OS by IPI; C, OS by Ki‐67 expression. The Breslow test found no differences among the groups (P = .921 for stage, P = .861 for IPI, and P = .338 for Ki‐67 expression). Abbreviations: IPI, international prognostic index; OS, overall survival
