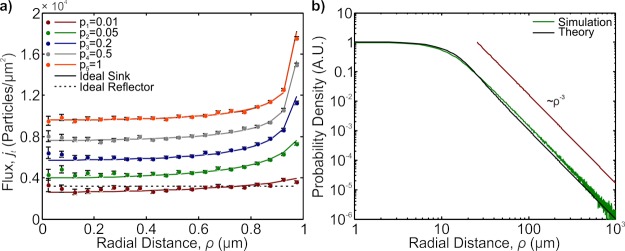
Figure 2.
(a) MC simulation of the position-dependent flux for various probabilities of adsorption (p = 0.01, 0.05, 0.2, 0.5, and 1). The solid black line is the theoretical curve obtained from a perfectly adsorbing patch (overlaps with p = 1 curve); the dashed black line represents the distribution of particle reflections for a perfect reflecting patch. As the p value changes from an ideal sink (p = 1) to an ideal reflector (p = 0.01), the divergence predicted from a perfect sink disappears and the distribution approached that of a uniform one. The solid colored lines represent the curves calculated from eq 7. The curves are offset to help distinguish different p values. (b) log–log plot of the tRFD (green) along with the approximate curve (black) described in detail in the Supporting Information. The ρ–3 curve is provided as a guide.

