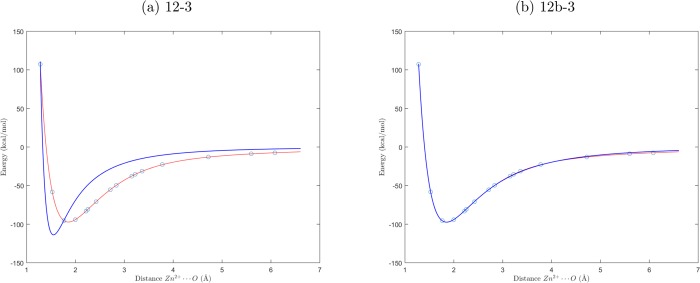
Figure 3.
Graphical representation of the potential energy curves of the models 12-3 (blue line, a) and 12b-3 (blue lines, b), compared with the target data (red line), namely the MP2/aug-cc-pVTZ energies (red lines) for the Zn2+···H2O interaction. The blue circles are the points included in the training set.

