
Fig. 3.
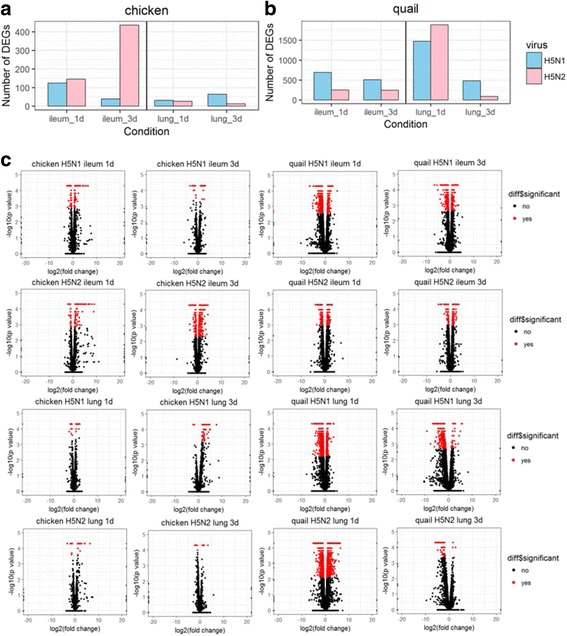
Global overview of DEGs in ileum and lung of chicken and quail infected with H5N1 and H5N2 at different time points. a-b Number of differential expressed genes in ileum and lung of chicken and quail infected with H5N1 and H5N2. Number of differentially expressed genes (DEGs) identified from the comparison among mock and virus infected groups (DEGs were identified based on p-value threshold of less than 0.05). c Volcano plot showing DEGs for ileum and lung of chicken and quail infected with H5N1 and H5N2 at 1 day post infection and 3 days post infection. The x-axis represents the log2 values of the fold change observed for each mRNA transcript, and the y-axis represents the log10 values of the p-values of the significance tests between replicates for each transcript. Data for genes that were not classified as differentially expressed are plotted in black