
Fig. 4.
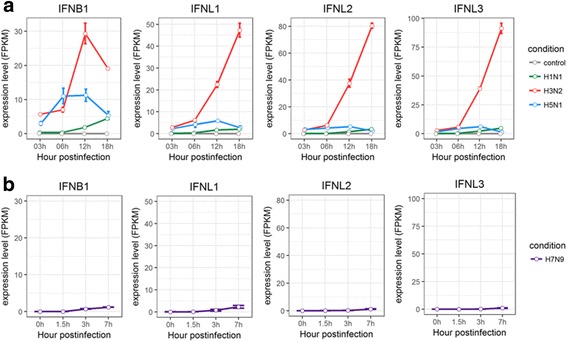
Expression profiles of IFNs in HTBE cells infected with H1N1, H3N2, H5N1 HALo mutant and A549 cells infected with H7N9. a The expression levels of IFNs in H1N1, H3N2 and H5N1 HALo mutant infected HTBE cells at different time points. b The expression levels of IFNs in H7N9 infected A549 cells at different time points. The gene expression is measured using FPKM reported by Cufflinks (Version: 2.2.1)