Fig. 3.

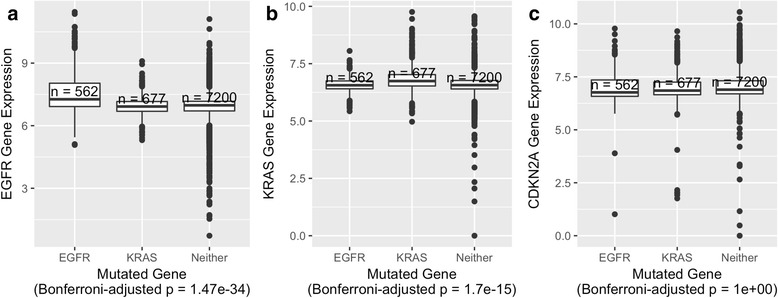
Associations between genomic aberration status and expression levels of individual genes across 25 cancer types. a EGFR expression levels for tumors with either an aberration in EGFR, KRAS, or neither of these genes. b KRAS expression levels for the same tumors. c CDKN2A expression levels for the same tumors. Expression levels are log-transformed, transcripts-per-million values. P-values were calculated using Welch’s t-test and adjusted using a Bonferroni correction
