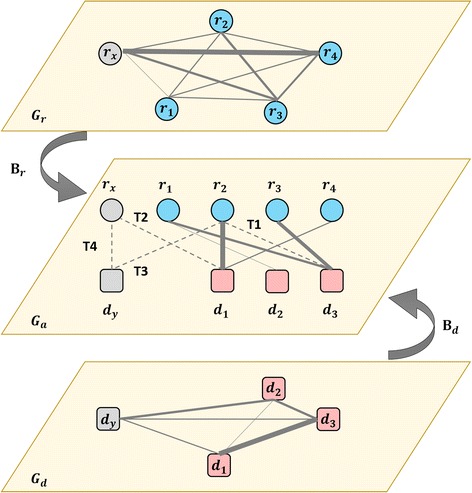
Fig. 1.

Graph regression for predicting the associations between lncRNAs and diseases. From top to bottom, G r, G a and G d are listed. Circle nodes and rounded square nodes denote lncRNAs and diseases respectively. In G r and G d, lines denote the similarities between nodes. In G a, solid lines linking nodes represent LDAs and dashed lines denote the pairs to be predicted. T1, T2, T3 and T4 account for four predicting tasks
