
Fig. 5.
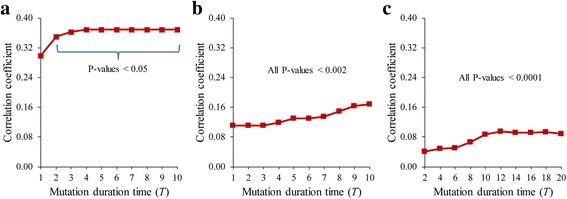
Relationship of the GDI value to the number of paths in the GDI networks. a-c Results of AMRN, ABAN, and HSN, respectively. Y-axis values mean the correlation coefficients between μ(v i, v j) and n(v i, v j) for all ordered pairs of genes. The mutation duration time was varied from 1 to 10 in (a) and (b), and from 2 to 20 in (c)