
Fig. 3.
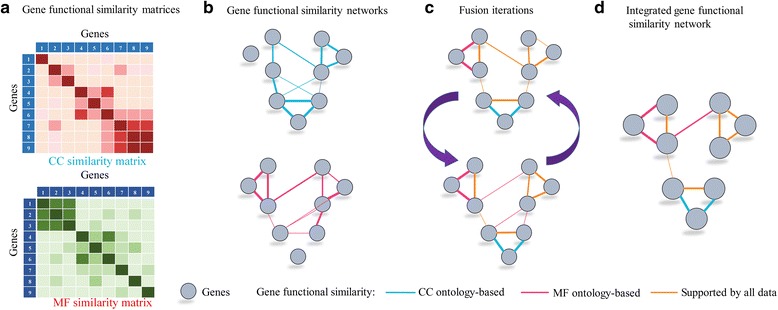
Illustrative example of SNF steps. (a) Gene-gene similarity matrices based on CC and MF ontology, respectively. (b) Gene functional similarity networks. Genes are represented by nodes and pairwise similarities between genes are represented by edges. (c) Network fusion by SNF updates iteratively, making them more similar with each step. (d) The iterative network fusion results in convergence to the final integrated network. Edge color indicates which data type has contributed to the given similarity