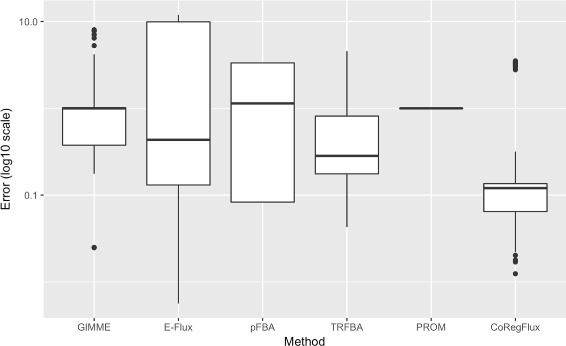
Fig. 4.

Results for robustness analysis in all conditions and for five different noise levels. The normalized error, corresponding to the difference between observed and simulated exchange fluxes, is shown on the y axis. A log10 transformation was applied to the data to improve readability. CoRegFlux had a lower median error than two other state-of-the-art methods, TRFBA and pFBA
