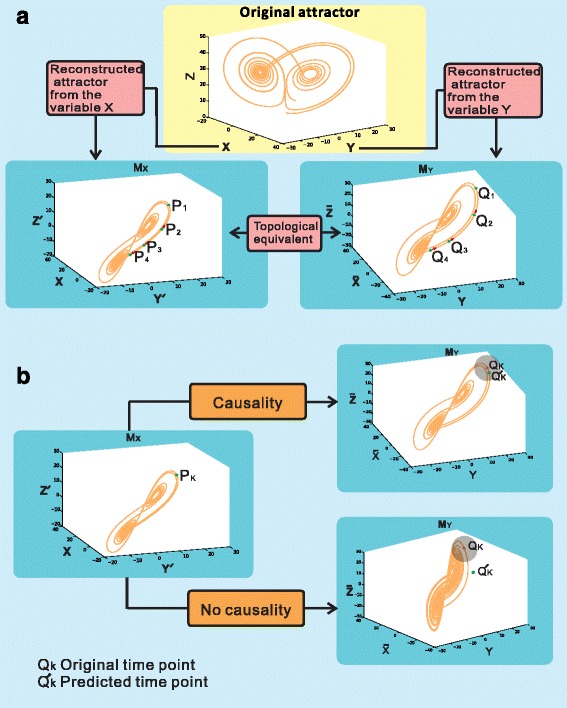
Fig. 1.

Definition of causality. a. the attractors M X and M Y are reconstructed from variables X and Y by lagged-coordinates and they are topological equivalent. b. The predicted time-series (points) are located in the nearest neighborhood of Q k (k = 1, 2, ⋯) which implies causality (see the above part). The predicted time-series (points) are outside the nearest neighborhood of Q k (k = 1, 2, ⋯) which implies no causality (see the below part). Here, the nearest neighborhood is measured by a ball with a small radius r (see the gray district)
