
Figure 1.
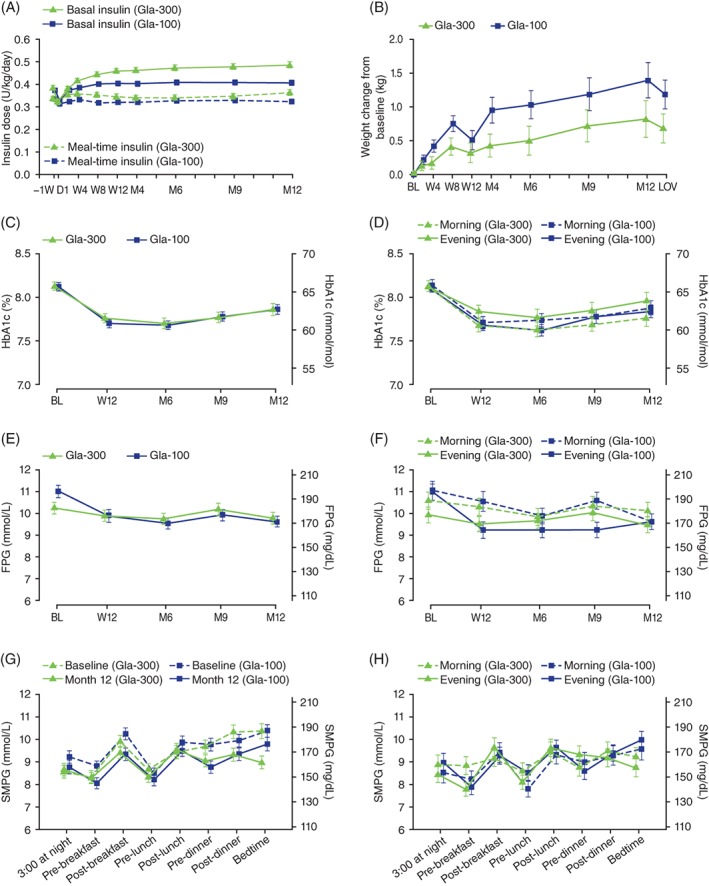
Time course of daily insulin dose (A), body weight change from baseline (B), glycated haemoglobin (C), glycated haemoglobin by basal insulin injection time (D), laboratory‐measured clinic FPG (E), laboratory‐measured clinic FPG by basal insulin injection time (F), SMPG profiles (G) and SMPG profiles by basal insulin injection time (H) over 12 months of treatment with Gla‐300 or Gla‐100. mITT population, except body weight change (safety population). Baseline body weight = 81.9 and 81.8 kg for Gla‐300 and Gla‐100 groups, respectively. Mean ± SE. BL, baseline; D, day; FPG, laboratory‐measured clinic fasting plasma glucose; LOV, last on‐treatment value; M, month; mITT, modified intention‐to‐treat; SE, standard error; SMPG, self‐monitored plasma glucose; W, week